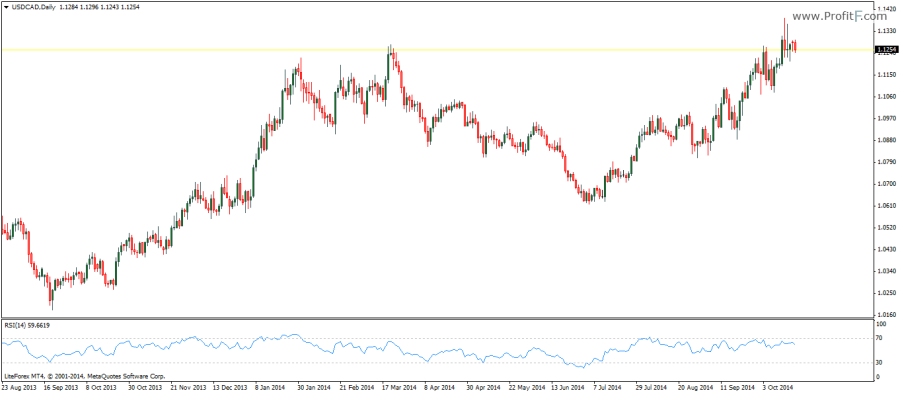
RSI indicator (Relative Strength Index) is a price following indicator that can be used to trade in many different ways. The RSI indicator compares the upward movements in closing prices to the downward movements over the look back period.
The standard setting for the RSI indicator is 14 periods and oscillates between the fixed values of 0 and 100 with 70 and 30 being the overbought and oversold levels. Other commonly used RSI settings include 7, 9, 13, 21 and 25.

The RSI indicator was developed by Welles Welder and is most commonly used for spotting divergences in price. Depending on the look back period settings the sensitivity of the RSI can be changed. There are some well known trading strategies that make use of a 2 period RSI where short and long positions are taken when the RSI moves from one of the extreme levels of 95 and 5. Besides the 2 period RSI, the default setting of RSI (14) is also used to identify trend strengths by plotting values of 80, 60, 40 and 20. When the RSI oscillates between the levels of 80 and 40, price remains in an uptrend and when the RSI oscillates between 60 and 20, price is expected to continue in its downtrend.
The RSI is also one of the few indicators which can be traded based on chart patterns such as head and shoulders, triangles and flag patterns