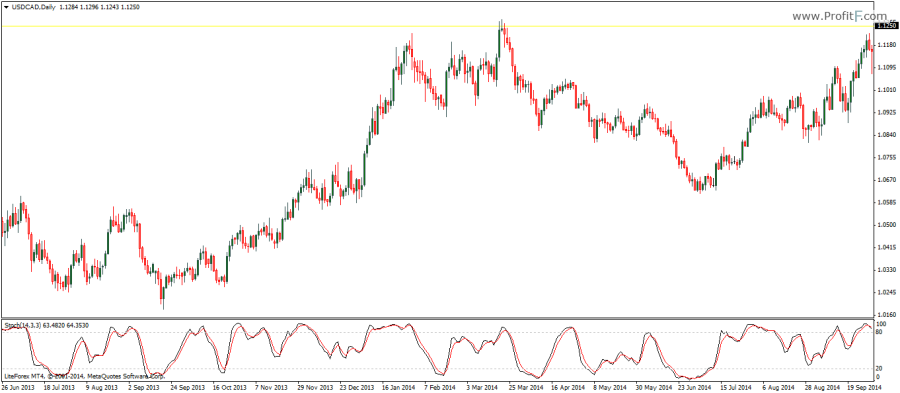
The Stochastics oscillator indicator is used to compare the closing price of a security to its price range during the look back period. The Stochastics oscillator comprises of two lines, the %K and the %D, which is a moving average of the %K line. The Stochastics oscillator is default to 5, 3, 3 settings applied to the High/Low which can be configure. Other commonly used settings for Stochastics include 14, 3, 3 and 21, 5, 5 based on which the sensitivity of the Stochastics oscillator can be changed.

The Stochastics oscillator was developed by George Lane and is used to track the momentum in the markets. Based on the configurations of the %K and %D lines and the look back period, Stochastics is often referred to as Fast Stochastics with a setting of 5, 4, Slow Stochastics with a setting of 14, 3 and Full Stochastics with the settings of 14, 3, 3. The Stochastics oscillator works especially well in identifying turning points within ranging markets.
The oscillator moves between fixed values of 0 – 100 with the overbought and oversold levels set to 80 and 20. Just as with most other oscillators, when the Stochastics oscillator’s %K and %D lines crossover and fall below 80, it indicates overbought levels and a short term decline in prices. Similarly, when the Stochastic’s %K and %D lines crossover and move above the 20 line, it indicates the market moving out from an oversold level.
Download Stochastics oscillator indicator
Add your review