Above 1,435, favor long towards 1,465 and 1,475. Under it, sell signals to go back to 1,405. Pay close attention to price activity at current level -1,45 1,4475-. Pay also attention to any news or poll concerning the Brexit.
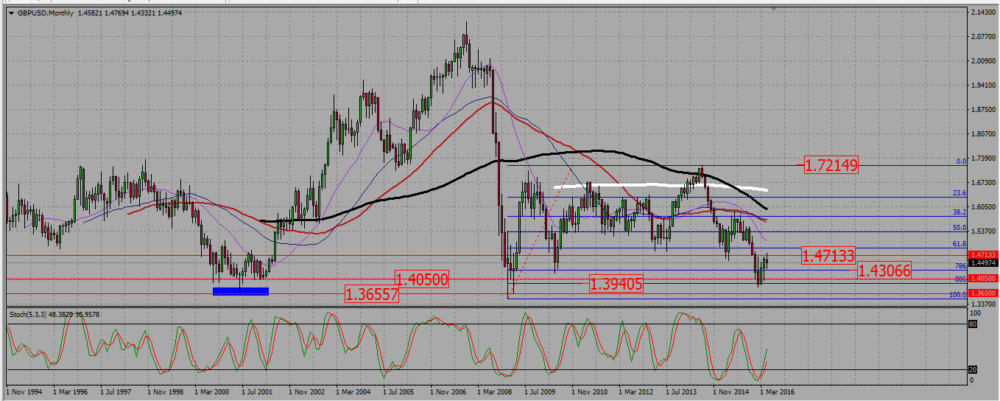
On the monthly chart and after breaking a low under 1,40, the pair climbed back around 700 pips. This month candle, with still one week to go, is a high waved candle, marking an indecision under a resistance near 1,47. However, the cable is currently very low, something we did not see since the 2008 crisis. On this graph, the pair has been twice at that level, and it bounced back every time. Be careful if you consider to sell the cable here.
GBPUSD MONTHLY CHART.

The weekly chart gives us two precious indications.
1-The 700 pips GBPUSD rally we saw on the monthly gave rise on the weekly to a higher lows – higher high type of move move, meaning we may be at the start of a bullish trend.
2-We may see huge up wicks on the last highs, around 1,465 and 1,475, meaning the resistances there are strong. The two candles marking the highs even looks like ugly shooting stars, which means a bearish signal. However, as long as we stay above the last weekly low, and as the cable is already very cheap, I will prefer to buy signals, even if the SMAs tell me we are in a bearish trend.
GBPUSD WEEKLY CHART.

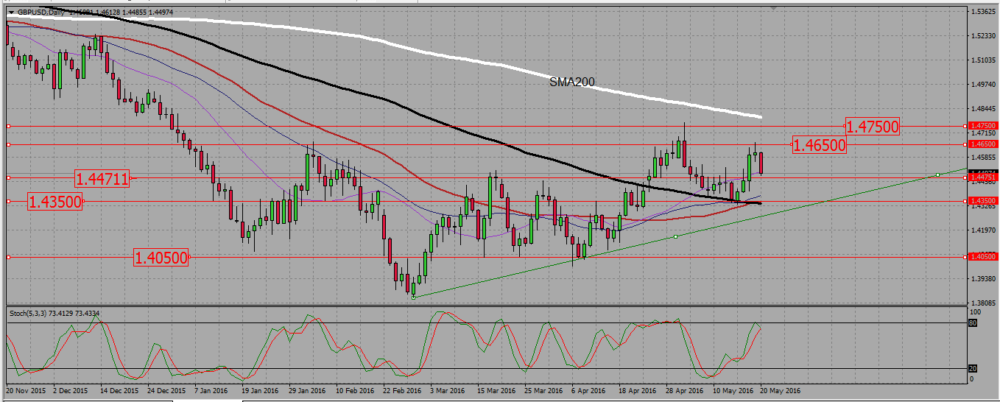
On the GBPUSD daily chart the first thing we see is the 1,45 -1,4475 level: it is a support being retested. If we are in a bullish consolidation, a signal at that level is a buy. Please take note of the 200 SMA going down and getting close to 1,475. It should offer a tough resistance and will be my take profit level.
The second thing we see is the bullish consolidation being quite complex, with some lower lows and a triple bottom at 1,405. This level is obviously a strong support and will be a take profit level for any short. A clean break down of it would be a selling signal.
On that chart and after rejecting the 1,475 level, the pair shows a lower high at 1,465. But as long as the 1,435 support is not broken, we are still in a bullish consolidation. Above that level, I prefer to buy dips. Under it, I will sell the cable towards 1,405.
GBPUSD DAILY CHART.

Add your review