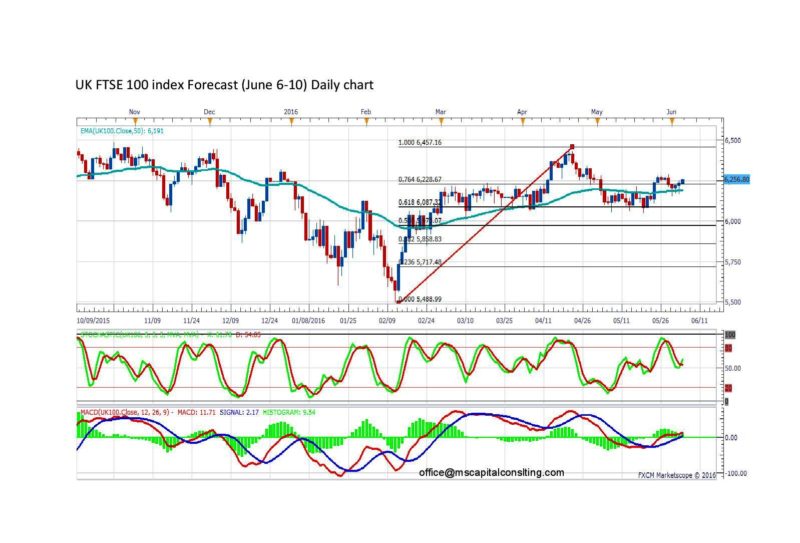
The daily chart indicates the uptrend for FTSE 100 Index. The price is still above EMA 50. The MACD is still positive and the stochastic oscillator confirms an uptrend continuation in the medium long term. The price may rise until 6450 in order to form a geometrical shape.

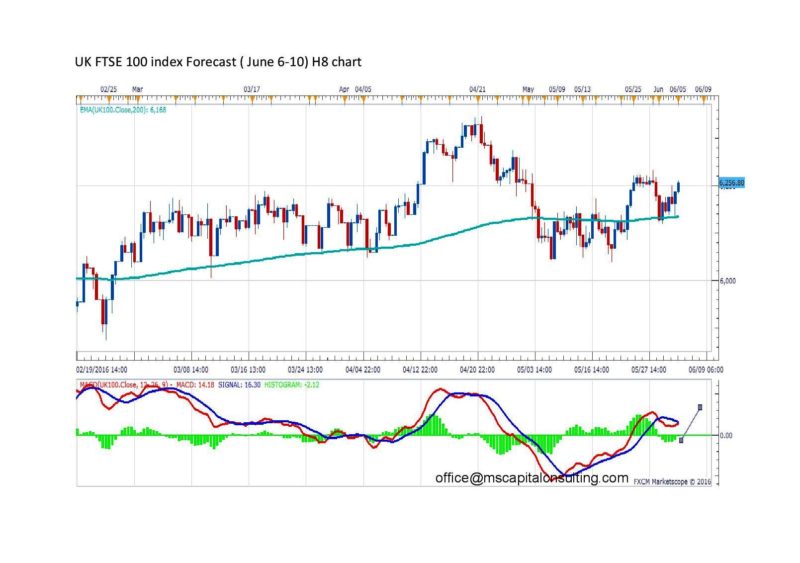
The price is still above EMA 200 on 8 hour chart. After 3 months of retracement, FTSE 100 Index may rise in the medium term.

Add your review