NZDUSD trading plan.
Sell signals under 0,705, buy signals above 0,725. Avoid taking positions in the middle, but consider entering reversal trades at those levels.
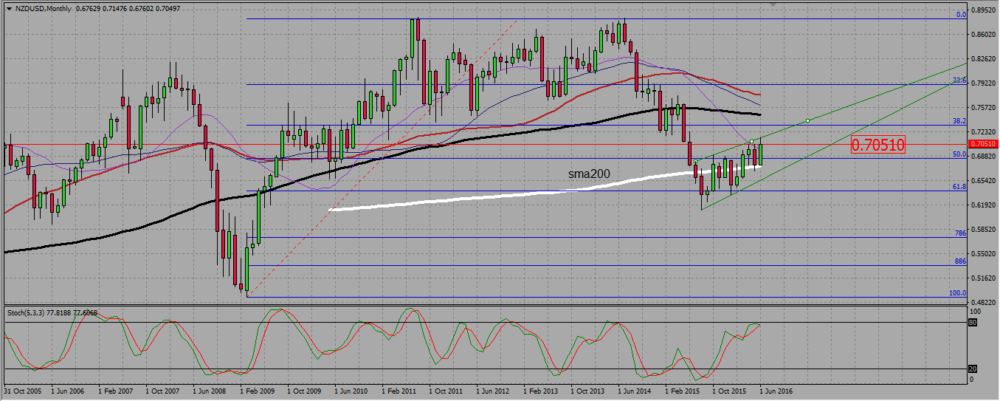
The monthly chart shows us a contrasted situation. The SMAs suggests a rather bearish situation, but the pair is consolidating within a bullish wedge. It has just reached the top of it, then went back down to close near a horizontal resistance at 0,705.
NZDUSD MONTHLY CHART.

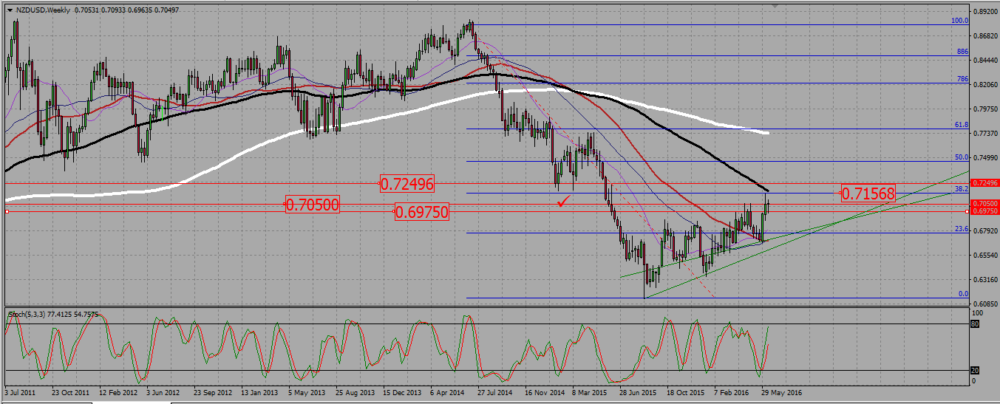
On the weekly chart, we see the pair consolidating within a bullish triangle, not unlike the euro. On that chart, four horizontal line that will be our key support/resistance levels.
0,725. The pair bounced from it as a support at the beginning of 2015, then broke it down on a new attempt at the beginning of June 2015. It stand now as a support. I want to see it broken up before entering a long trade in that area.
0,7155 is a fib line, with the 100 SMA pointing down and getting close to it. It stopped the pair from getting higher last week. It may be a tough support/resistance to pass, and this is why with another support and another resistance merely 100 pips away, I prefer not to enter trade at all around that zone.
0,705 is the line we identified on the monthly chart. It is currently being retested with an indecision candle (a doji). The pair may go either way.
Last, we see a secondary line near 0,695. This is a broken resistance. It does not look as strong as the three other lines, but you need nonetheless to check how price action react to it should the pair retest that level, especially if you are in a trade.
NZDUSD WEEKLY CHART.

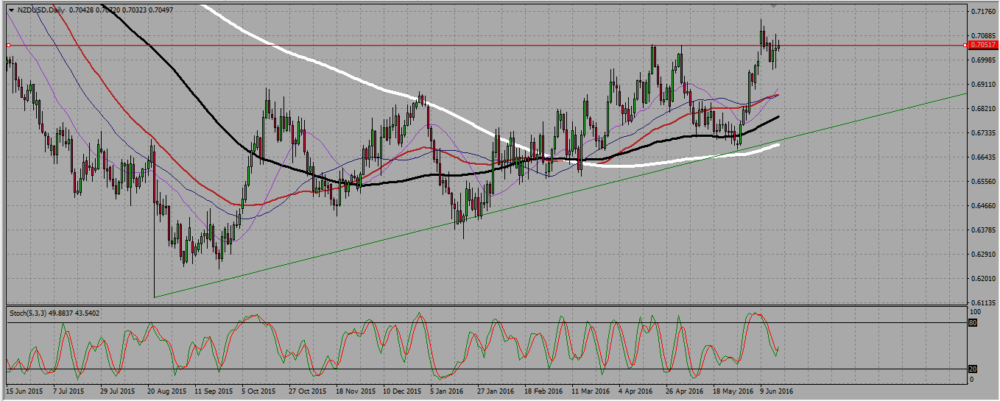
On the daily chart, we see the pair in a bullish triangle. It is hesitating near the resistance at 0,705. Should it reject that resistance, it should go towards the support trend line currently near 0,6775, assuming it passes through 0,695.
NZDUSD DAILY CHART.

Add your review