Under 1,12, favor selling towards 1,0825. Buy signals above 1,12.
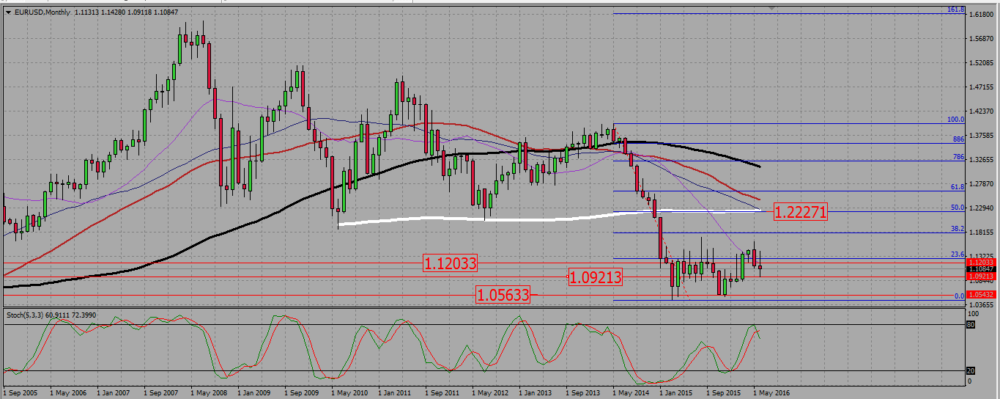
On the monthly chart, we end June with an indecision candle, that rejects a resistance/support line around 1,12. It is also trading over a support zone around 1,09 1,10. The SMAs are pointing down.
EURUSD MONTHLY CHART.

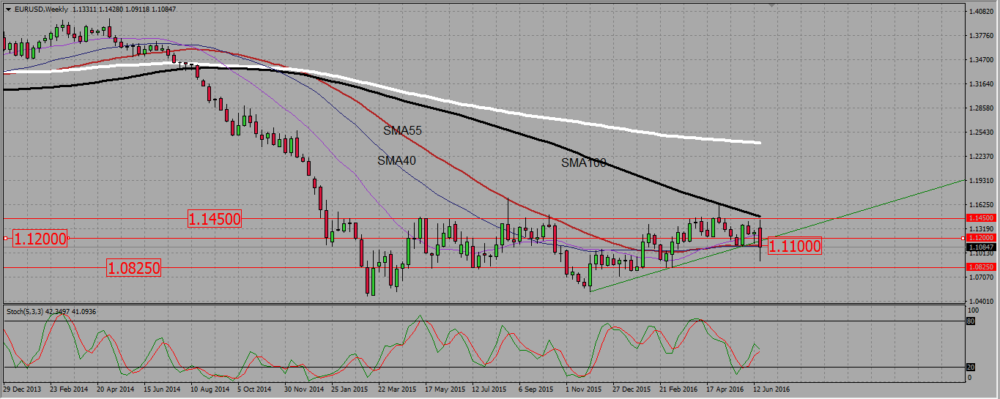
On the EURUSD weekly chart, the pair has broken a support trend line, but the breaking candle has a strong down wicks, and closes just above a bunch of SMAs (55 and 40) at 1,11. According to the best trading books, a broken support trend line is a resistance, and its current level is 1,118. Should the pair consolidates up by the beginning of next week, it will meet that resistance near 1,12. This is why under 1,12 I will look only for selling signals, but may consider buying signals above that level.
EURUSD WEEKLY CHART.

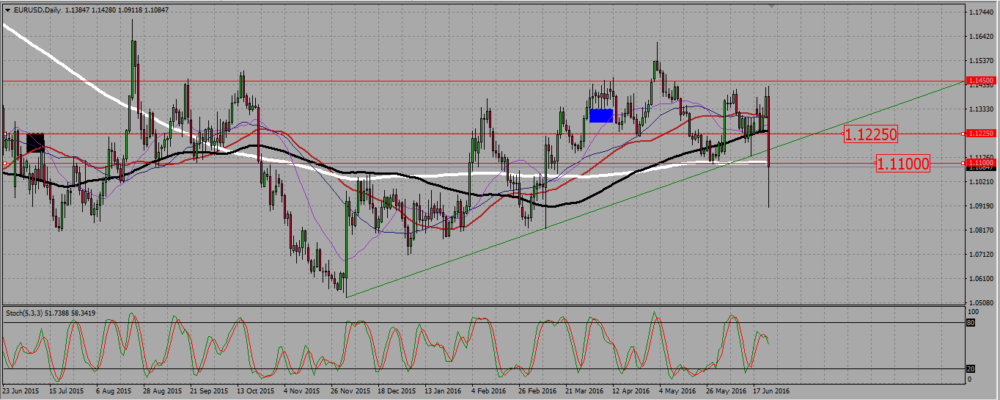
The daily chart shows a huge “Brexit” candle. This is also a case where a technical analysis shows its limit; the market is now moved by fundamental facts, and that may very well continue on Monday. But from a purely technical point of view, the only way to trade such a candle is to look for selling, after a possible consolidation. The pair currently stands on a support around 1,11, and the next resistance is around 1,1225. This is where I plan to look for selling signals. Above 1,1225, the pair will probably resume its bullish consolidation.
EURUSD DAILY CHART.

Add your review