USDCAD TRADING PLAN
The pair is trading within an indecision zone between 1,30 and 1,263, with an inside support/resistance level at 1,28. The weekly chart suggests CAD should rather go up, although it is consolidating within a bullish triangle on the daily chart. Watch price action at 1,315, 1,30 and 1,28. Buy between 1,30 and 1,28, consider selling a strong reversal at 1,315, buy a confirmed break up.
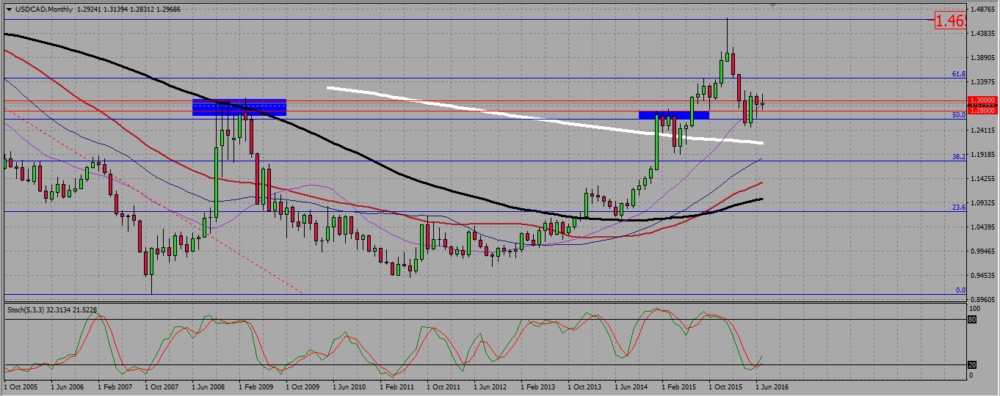
On the monthly chart, all SMAs are pointing up and are parallel, except the 200 SMA: we are within a strong bullish consolidation. The pair rejected a 786 Fibonacci level resistance near 1,46 in January, and then went back to retest a wide support zone located between 1,30 and 1,26. There was a bullish engulfing candle in May, but no follow through. The stochastic oscillator gave a buy signal by the end of June.
USDCAD MONTHLY CHART.

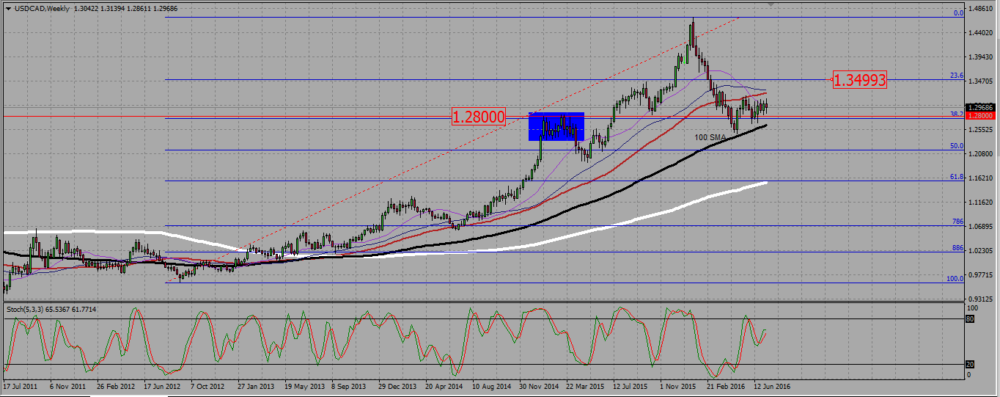
The weekly chart shows a clear uptrend situation, and it is the main reason why I want to buy this pair. The loonie has been going up for more than three years now, driven by a drop in oil prices. The bearish consolidation that took place since January 2016 seems to have ended when the pair met a support at the 100 SMA by the beginning of May, which it rejected with a bullish engulfing candle. Since then, and although it has not shown any particular bullish strength, it managed to break up a resistance at 1,28, where a 38,2 weekly Fibonaci level is located. After that it has ranged between that level and 1,30, but as long as it stays above 1,28 and/or above the 100 SMA, I would rather look for buying signals.
USDCAD WEEKLY CHART.

See daily forex live chart – the pair in a bullish triangle, with a resistance near 1,315. The pair is trading just under 1,30, where the 100 SMA is located. You may trade that triangle as any consolidation figure, taking confirmed breaks outside of it, and entering reversal on simple signals.
USDCAD DAILY CHART.
