Forex Weekly Technical Analysis based on the Support, Resistance levels, Trend lines, EMA.
(Forex weekly forecast by Camilo R.)
AUD/USD, EUR/USD, GBP/USD, USD/JPY, USD/CAD
Helpfull links: Real Time Forex Charts (Live), Forex Economic Calendar news (Live)
AUD/USD Weekly Forecast
Monthly Chart:
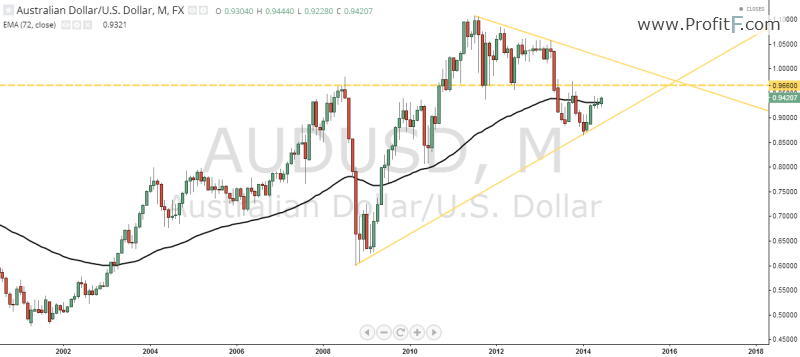
At monthly chart just 4 things to care about, the first one is the yellow resistance line at 0.9660, second the yellow support trend line, the third is the EMA 72 where the price is touching now, and the fourth is the resistance down trend line some good pips above.
Weekly Chart:
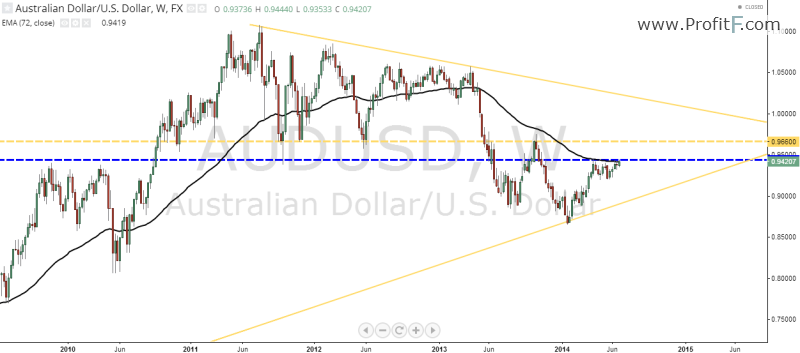
At weekly chart more two thing care, the blue resistance line at 0.9435 and the EMA 72 that is holding the price right now.
Daily chart:
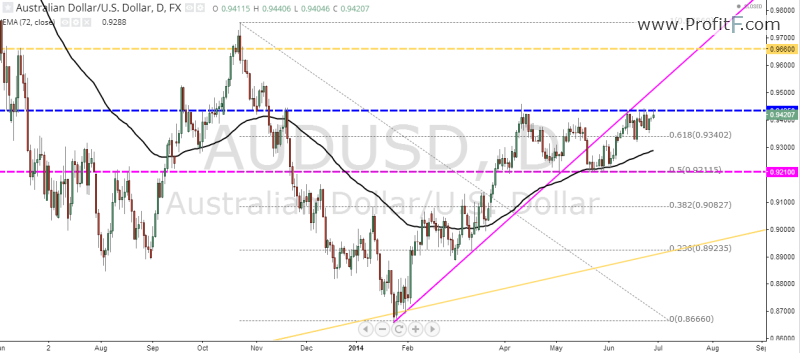
At daily chart the price is tied in a horizontal area between the weekly resistance at 0.9435 and the daily support at 0.9210, this area is around the 61.8% of the last Fibonacci retraction. There’s a up trend line broke and the pull back is already done. The break of any one of the horizontal lines may generate good pips. The best is the break for down side, because the monthly and weekly EMA 72 is generating resistance for the price and the last Fibonacci retraction is down.
EUR/USD Weekly Forecast
Monthly Chart:
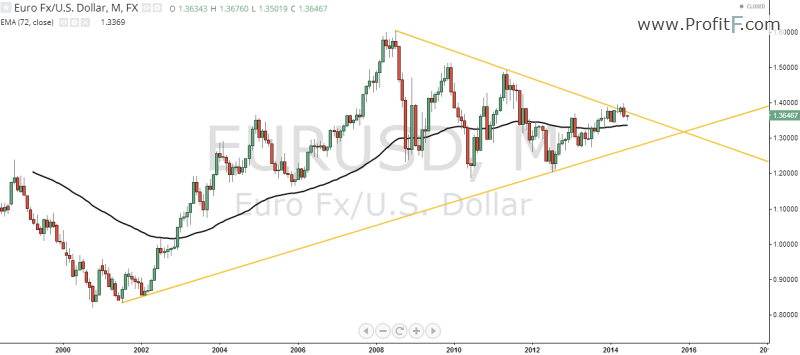
Just to things to care about at monthly chart, the yellow downtrend line where the price is touching now, and some pips below the uptrend line.
Weekly Chart:
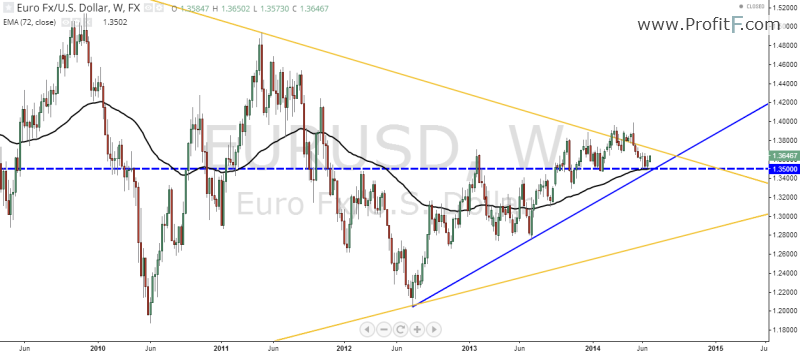
At weekly chart we see a blue support line and the EMA 72 who held the price some days ago and a blue uptrend line right below.
Daily Chart:
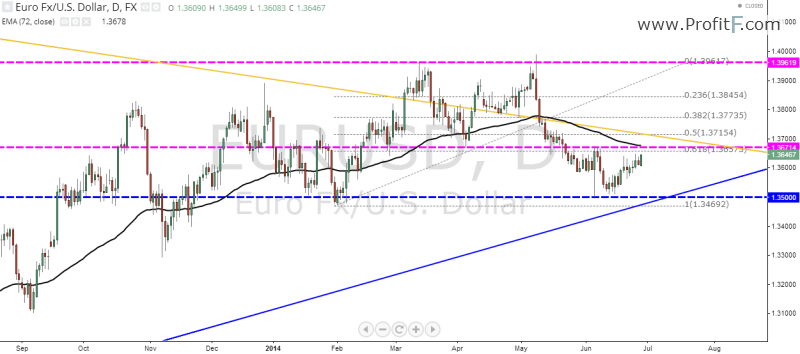
At daily chart we see more two resistance lines and the last Fibonnaci retraction. The price is tied in a area between the weekly support and daily resistance. The main scenario for this pair is up, but to get a good trend again he have to break the monthly downtrend line, the two resistance lines at daily charts and EMA 72.
GBP/USD Weekly Forecast
Monthly Chart:
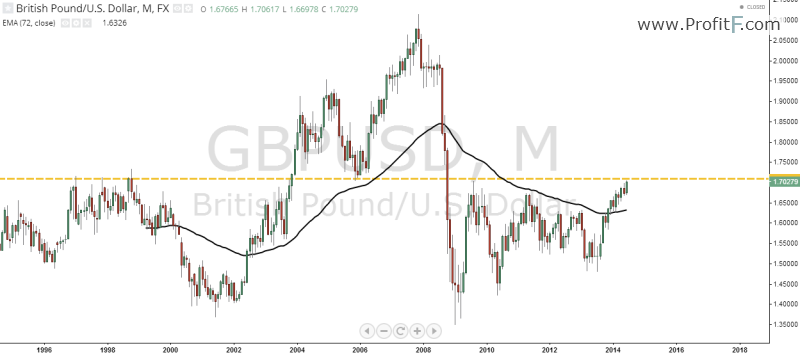
At monthly chart we have only one thing to care about, the yellow resistance line at 1.7100 the price may have some problems to break this.
Weekly:
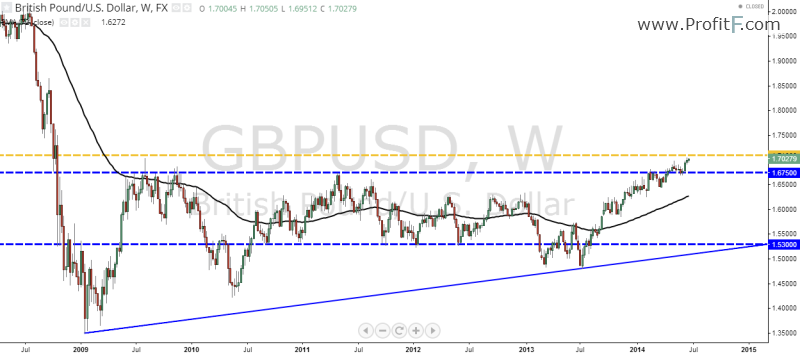
At weekly chart we find more 3 points to care about, the blue support line at 1.6750 where the price may come back if they don’t break the monthly resistance, the blue trend line of support and the horizontal support line at 1.5300.
Daily Chart:
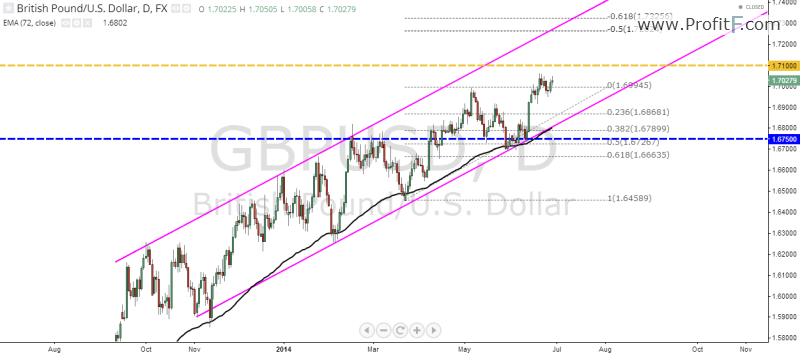
At daily chart we can see a beautiful up channel. The price is breaking the last high and may be looking to arrive 150 or 161.8% of Fibonacci extension but to do this he need to break the monthly resistance line at 1.7100.
USD/CAD Weekly Forecast
Monthly Chart:
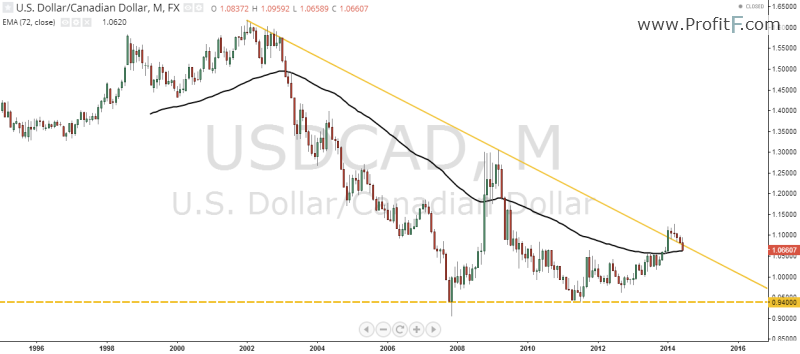
At monthly chart we see one down trend line where the price tried to broke but is get down again, the EMA 72 as support and a support line at 0.9400 very far away from the actual price.
Weekly Chart:
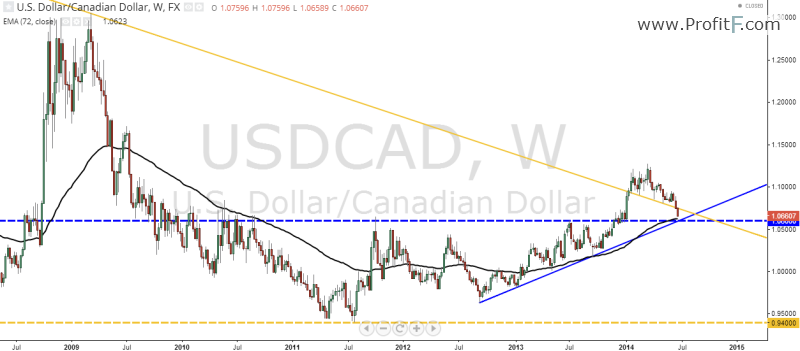
At weekly chart we can see a up trend line, a support line and the EMA 72 crossing some pips below the actual price.
Daily Chart:
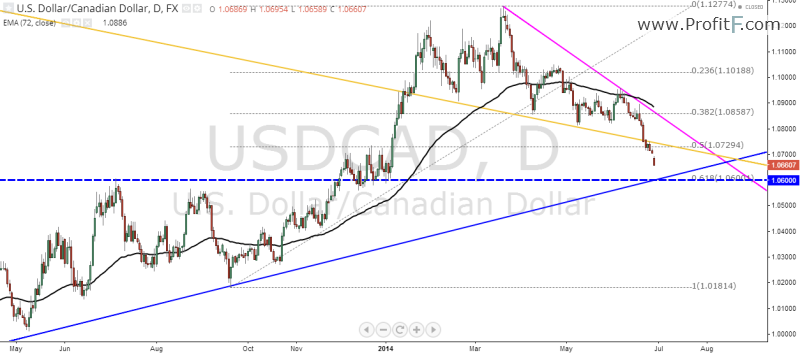
Just one thing to care about at daily chart, the pink down trend line. The price is approaching a very strong support area with five factors to hold the price: the blue weekly support line, the blue weekly trend line, the 61.8% of Fibonacci retraction, the monthly EMA 72 and the weekly EMA 72. May be that is the area the pair is looking to start go up again
USD/JPY Weekly Forecast
Monthly Chart:
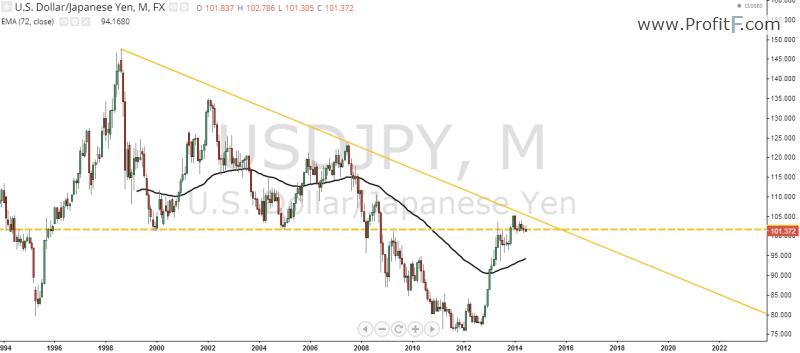
Two things care attention at monthly chart, the downtrend line where the price is very close and the support line at 101.70 who is holding the price.
Weekly Chart:
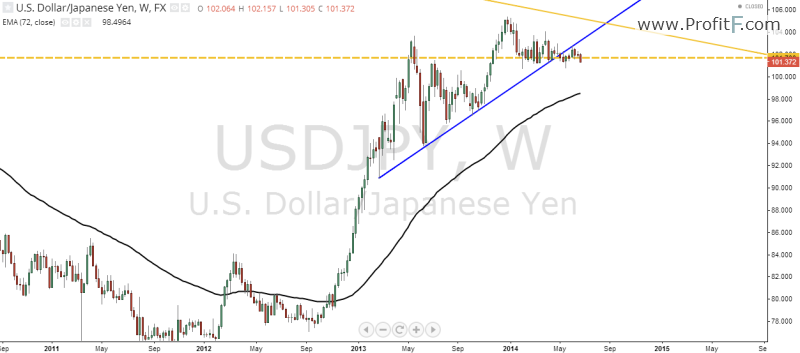
Just one thing need attention at weekly chart, the blue uptrend line broke and already retested.
Daily Chart:
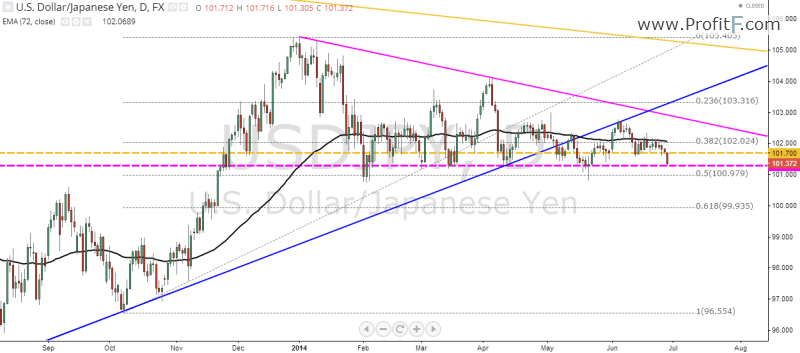
At daily chart we can see a pink support line at 101.280 and a downtrend line. The last Fibonacci is up but the pair is giving signals of weakness like the broken weekly trend line and the daily triangle pattern.
————————
See other Forex Weekly Analysis in category “Forex Weekly outlook” of ProfitF website
Add your review