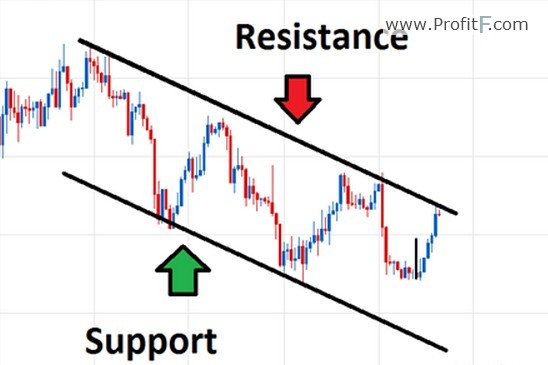
Price channels are a trading concept that is borrowed from the traditional trend line concept. Instead of plotting a simple trend line, the price channels comprise of two trend lines, upper and lower trend lines. Trade signals are taken when price breaks out of the upper or lower trend lines or the price channel. When combined with support/resistance methods and candlestick patterns trading price channels offers a great way to trade the markets. It is worth mentioning however that price channels trading requires quite a bit of practice and analyzing the market structure.
There are many different forms of channels that can be used. The most common price channel tools are:
Using the Price Channel Tool
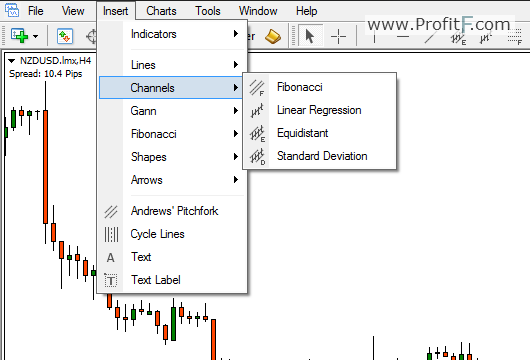
The Price channel is one of the standard tools available in most charting packages. On the MT4 trading platform, the Price channel can be accessed by clicking on Insert>Channels> and selecting one of the channel tools for drawing.
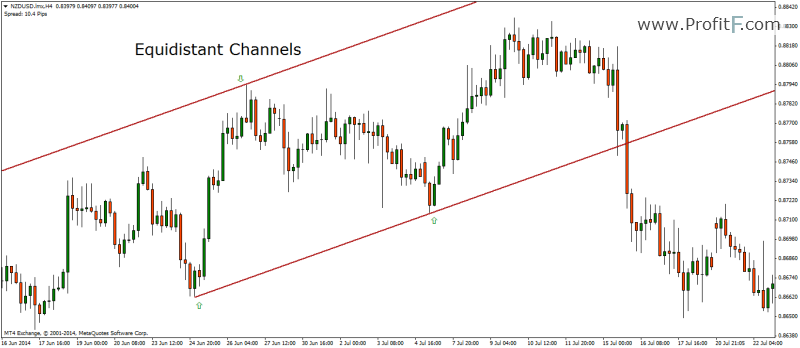
Channels are plotted in the same way as trend lines. This means, two consecutive swing lows or highs are required. For most channel tools such as Fibonacci, Regression Channels and Standard Deviation channels, only two lows or highs are required. For equidistant channels, a low/high/low or high/low/high is required.
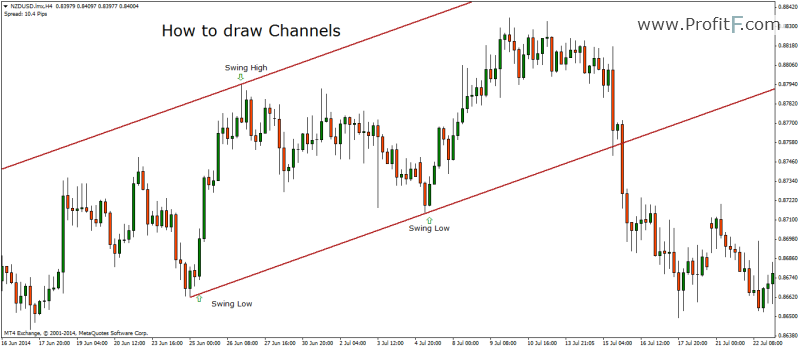
The chart above shows how a channel can be drawn.
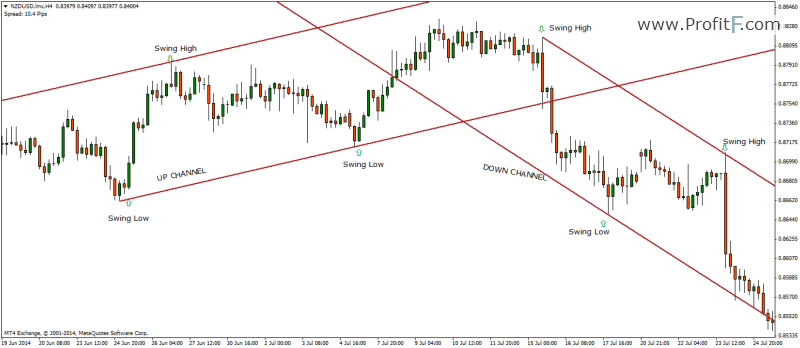
The Chart below shows the up and down channels and how they are plotted.
Explanation of the different Channel Tools
Fibonacci Channels: The Fibonacci channels require two consecutive lows or highs to be plotted. The channel lines are divided into Fibonacci levels of 0.618 and 1.618. Each of the channel lines represents support/resistance levels.
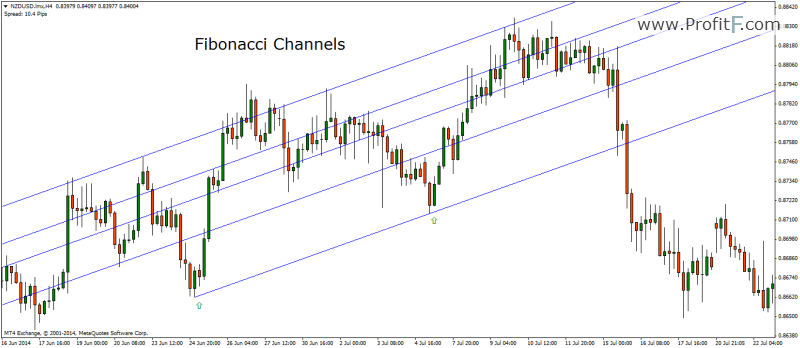
In the chart above, the Fib channels were plotted with the two lows marked by the arrows. The Fib channels have levels of 0, 1, 0.618 and 1.618. The Fib channels can be adjusted to connect the third channel to an intermediate high (or low).
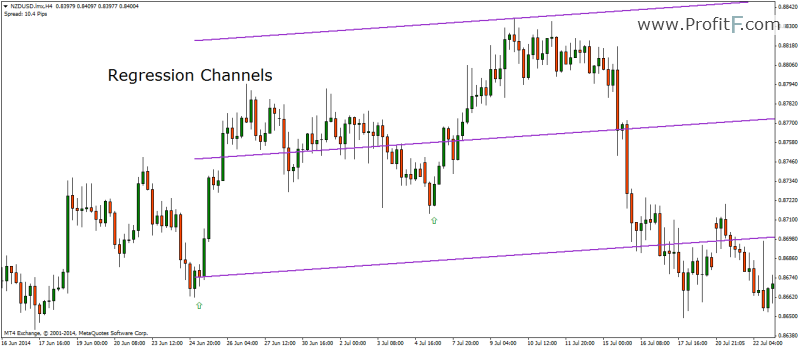
Linear Regression Channel: The linear regression channel is drawn the same way of connecting two consecutive highs or lows. The linear regression channel then plots the channel to best fit the price and varies from other channel tools.
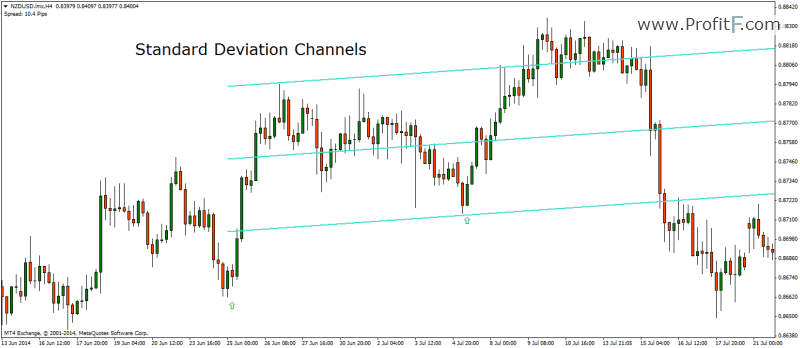
Standard Deviation Channels: The standard deviation channels are channels that are plotted based on 1 or 2 (or more) standard deviations specified in the indicator settings. The standard deviation channel is used to measure how much price deviates from the channel (i.e: how many standard deviations).
Equidistant Channels: The simplest of all channel tools, the equidistant channel measures the equal distance within the trend from the highs and lows. The equidistant channel tool makes use of high/low/high or low/high/low pivots to plot the tool.
How to trade using Channels
Channel Trading in Forex allows a better perspective of the market structure compared to merely trading with trend lines. Long and short positions are initiated at the top and bottom ends of the channels, depending on the slope of the channel itself. Alternatively, traders can also be initiated when the channel is broken and successfully retested for support or resistance.
Channels are nothing support and resistance levels plotted in a slope. The chart below explains this in detail. Here, we notice that after using the High/Low/High swing points a down slope or a down trend channel is plotted. Notice how the swing points shows a confluence with past horizontal support and resistance levels.
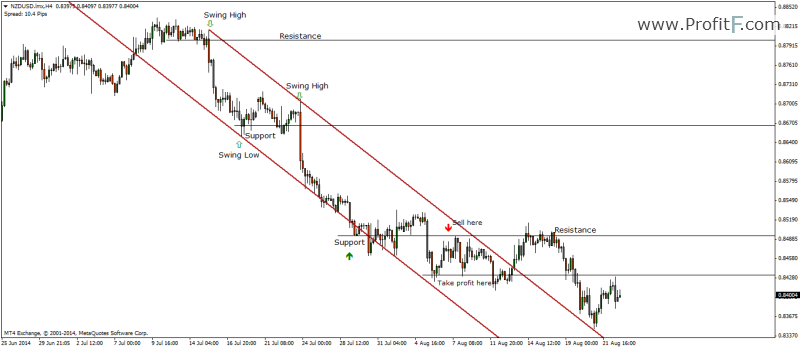
As price action unfolds, we notice further down the channel of a small retracement towards the upper end of the channel. This offers a good sell opportunity with target booked at the previous support level.
Within the same chart, we also notice how breaks out of the channel only to drop a bit further down to take support from the upper end of the channel. This is a classic channel break out pattern, where a retest of the channel takes place before a new uptrend is established. The chart below gives another example of how the channel break out pattern plays out with a retest of the channel before resuming the uptrend.
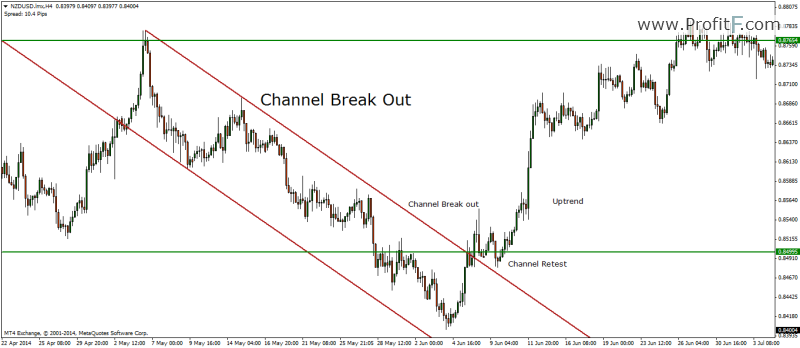
Channel Trading Strategy
It is probably best to trade break outs from channels rather than trading within the channel.
To trade the Channel break out, the following criteria is used.
The chart below shows an example of how to trade the channel break out.

Channel Trading – Summary
Channel Trading in Forex can offer a great way to trade with minimal of indicators. Of course, the signals can be further enhanced by using oscillators such as Stochastics or MACD to confirm the direction of the trade. With due practice channel trading can be an easy way to trade the markets.
Add your review