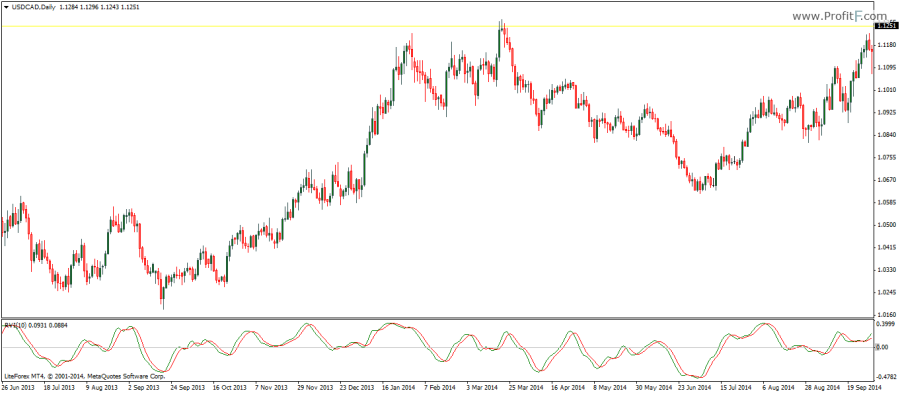
RVI indicator (Relative Vigor Index) works on the concept that in an uptrend the closing prices tend to close higher and in a downtrend, closing prices tend to close lower. In essence, the RVI measures the strength of the current bar in relation to the main trend. The indicator therefore calculates the closing price relative to the price range of the look back period, whose values are then, smoothed using a moving average. The RVI indicator works on the similar concept of the Stochastics oscillator with the difference being the vigor index.

The RVI oscillator comprises of the Vigor Index and the Signal line which is the smoothed moving average of the vigor index. The indicator oscillates above and below the 0-line with the 0-line acting as a trigger. When the RVI is below o-line and rises above it with a bullish crossover, it indicates rising prices and thus triggers long positions and when the RVI makes a bearish crossover and falls below the 0-line it indicates declining prices, triggering the sell signal.
The most common setting or look back period for the RVI oscillator is 10 periods, but it is common to use 7, 9, 14 periods for the RVI oscillator as well. Divergence based trading can be also be one of the uses of the RVI oscillator.
Add your review