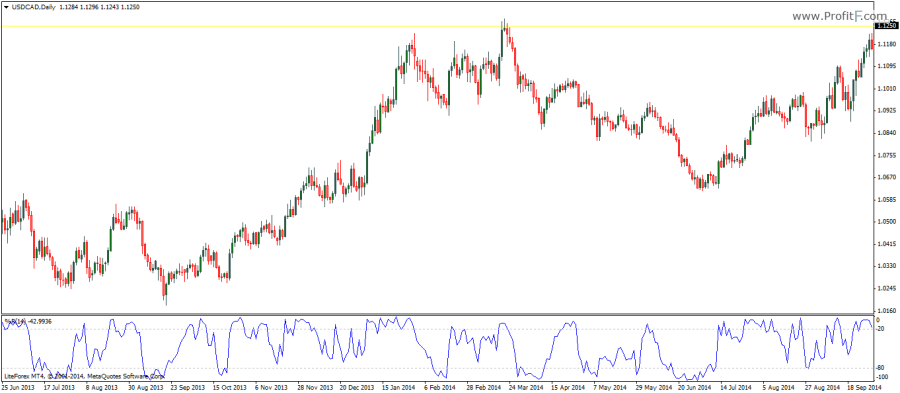
The Williams Percent Range indicator is commonly referred to as the %R indicator and is used to identify the overbought and oversold levels in the markets. It is almost similar to the Stochastics indicator and is visually similar to the Relative strength index.

The %R indicator oscillates between 0 – (-100) value with the -80 and -20 acting as overbought and oversold levels. The most noticeable feature of the %R indicator is the negative values of the oscillator. The %R indicator tends to reflect short term price tops and bottoms as the %R has the uncanny ability to show the peaks and troughs ahead of price. The %R indicator is defaulted to 14 period look back but 5 and 21 are other common settings that can be used with the %R indicator.
The %R is calculated by dividing the difference between the highest High over the look back period and the current closing price and the difference between the highest High and the lowest Low during the look back period, multiplied by 100.
Buy positions are taken when the %R indicator starts to rise from the oversold conditions -20 and short positions are taken when the %R indicator starts to decline from overbought conditions of -80. Divergences are also another common way to trade the %R indicator.
Download Williams Percent Range indicator