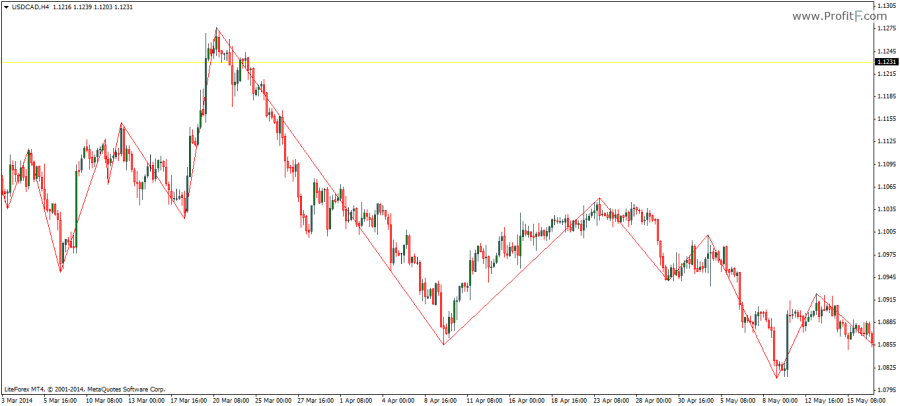
The Zig-Zag indicator is nothing but trend lines that connects highs and low in the prices and thus provides a visual confirmation of the interim highs and peaks in the market. It is a dynamic indicator and therefore the final high or low can be changed if a new high or a low is plotted in the market. As a matter of fact, the Zig-zag indicator is a tool rather than an indicator as it is used to filter out the small price movements in the market.
It merely tracks and connects the extreme points in the markets. The Zig-zag indicator comes with the standard settings of Depth, Deviation and Backstep, with default values of 12, 5 and 3.
Depth: The minimum number of price bars required where there is no secondary high or low.
Deviation: The number of pips that pips can deviate above the previously plotted high or low for the Zig-zag indicator to re-change its highs and lows
Backstep: The minimum amount of bars between which the highs and lows can be plotted.

The Zig-Zag indicator is commonly used for Elliott wave counts as well as other measured moves such as the AB=CD patterns and is used for easy identification of chart patterns such as the head and shoulders.
Thank you for this explanation, couldn’t be more clear.