According to the daily chart, this pair is still overbought. GBP/NZD might fall around 2.06 where is Fibo 61%. A triangle was formed on MACD between February 2 and May 22. This triangle indicates also the retracement for this pair.
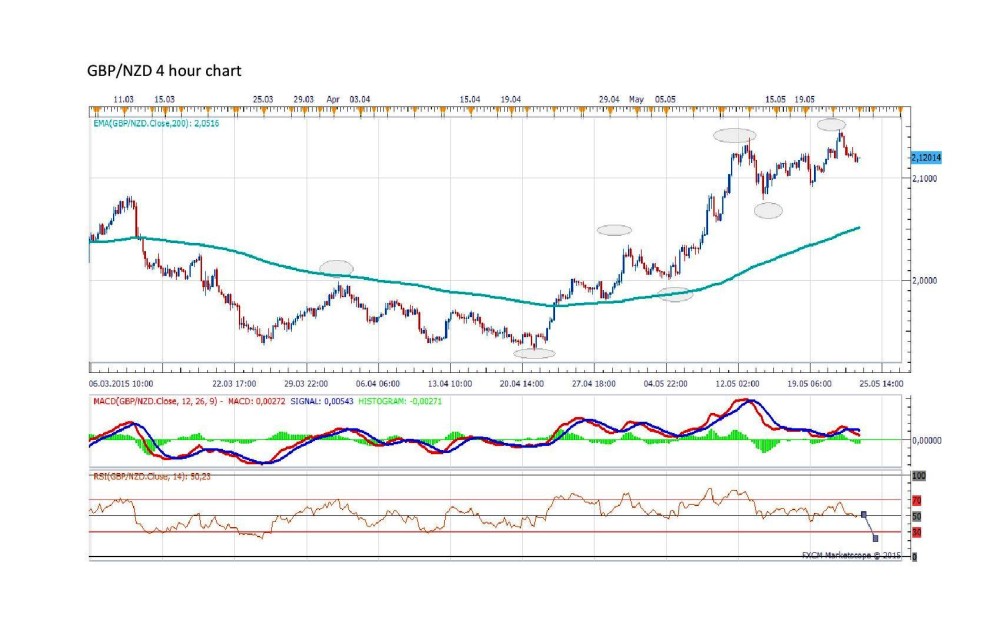
Also H4 chart indicates the beginning of the decline for GBP/NZD below RSI50. This pair might fall in medium term below 2.05 where is EMA200
Add your review