TABLE OF CONTENTS:
Multiple TimeFrame analysis (MTF) is considered to be one of the most robust technical analysis models, where in, the trader analyses at least two or more different time frames in order to draw up a trading plan. For the average trader, multiple timeframe analysis could seem to be a bit complicated due to the various timeframes involved. But with a disciplined approach a trader could very well incorporate multiple timeframe analysis with ease.
Of course, with multiple timeframe analysis, the biggest issue with “Analysis Paralysis” With multiple timeframe analysis, it is easy for a trader to end up overanalyzing their charts resulting in analysis paralysis; the moment where you end up being confused or end up with conflicting views of the markets all together. The easiest way to avoid such traps is to have a firm plan in mind before looking to multiple timeframes to generate more robust trading ideas. Benefits Of Multi Time Frame Analysis
The first question that comes to mind when talking about multiple timeframe analysis is its effectiveness and whether this approach offers any value to the trader, or gives an edge. The simple answer is Yes; but only when applied correctly.
The main purpose of multiple timeframe analysis is for the trader to time their entries and exits. The importance of multiple time frame analysis could best be illustrated with an example.
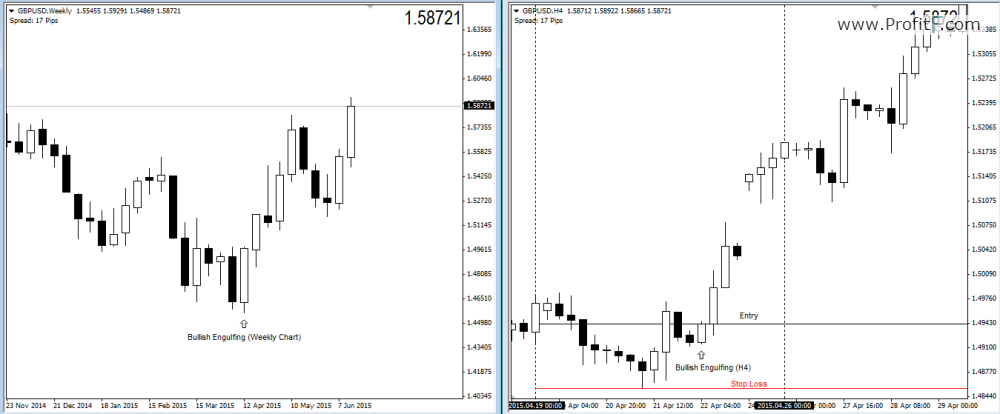
You spot a bullish engulfing pattern on a weekly chart. This simply tells you that the next and a few candles could close bullish. But at which price would you enter long? Do you simply enter long at the open of the next weekly candle and risk the retracement that generally applies?
With multiple time frame analysis in forex your entry can be timed such that you minimize your risk while maximizing your profits. The chart below illustrates one such example of how multiple time frame analysis helps. In this example we take a look at the GBPUSD currency and apply weekly and H4 multiple time frame analysis to find a better level of entry and this minimize risks.

GBPUSD – Weekly/H4 Multiple Time Frame Analysis
Besides the above example, traders can use multiple time frame analysis in different ways, some of which are summarize below:
Indicator based: One of the simples and common uses of MTF is based on indicators. Example, if the Stochastics indicator gives a buy signal on the Daily chart, then the trader would shift to H1 chart and wait for a buy signal to be triggered which helps in timing. Using moving averages under MTF is also a popular method
Price Action: Support/Resistance, trend lines etc. are also commonly used to apply multiple time frame analysis in order to fine tune the entries. Traders usually make note of higher time frame support/resistance levels and trend lines and use them as profit targets or stop loss levels while use the lower or smaller time frame support/resistance levels and trend lines for entering new positions. (read more about Price action trading)
When traders consider multiple time frame analysis, they should also take into account the time it takes for holding the trades. The table below should give a quick summary for traders:
| Time Frame | Holding Period | Type |
| 1 minute – 15 minutes | Intraday or scalping (positions are closed within the trading day) | Scalping |
| 30 minutes – 1 Hour | 2 or 3 days of holding period | Scalping/Short Term |
| 4 Hour – 1 Day | 2 or 3 days and up to one week | Short Term |
| 1 Week | Few weeks to a few months | Long Term |
| 1 Month | At least a couple of months | Long Term/Swing Trading |
Add your review