
When it comes to MT4 charts, not all brokers are created equally. Depending on the MT4 broker’s server time, the charts or the candlesticks on the charts are calculated differently. For example, most GMT brokers tend to have an additional candlestick such as Sunday candlesticks as well. While this might seem to be not much of an issue, when making use of pivot points (especially daily pivots that are used on the intraday charts) the pivot values vary quite differently.
Besides the aspect of the different in pivot points, even the indicators such as moving averages or oscillators such as Stochastics or RSI are also calculated differently in comparison to regular GMT+2 or +3 brokers.
The first chart below gives one such example. In the chart below, we make use of a GMT broker, where the ‘Sunday’ candlestick is shown on the chart.
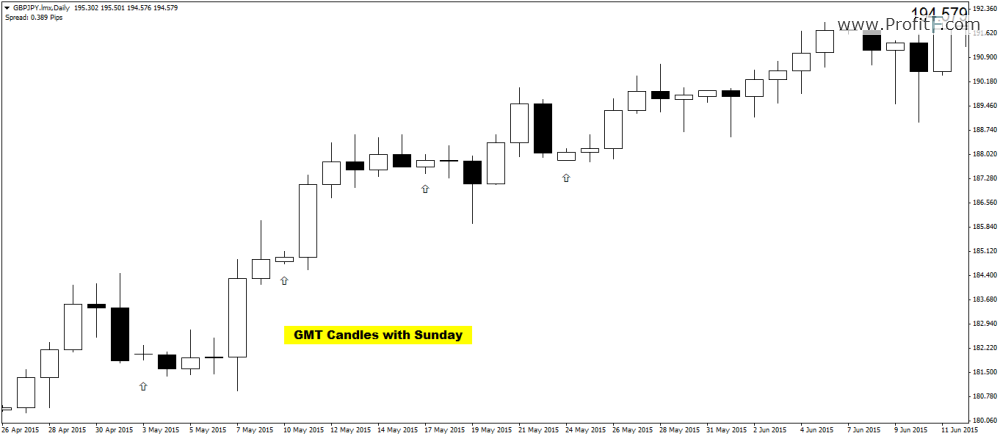
GMT Broker with Sunday Candles
The next chart below illustrates the same GBPJPY daily chart but without ‘Sunday’ Candlesticks and based off GMT+2 (or +3).
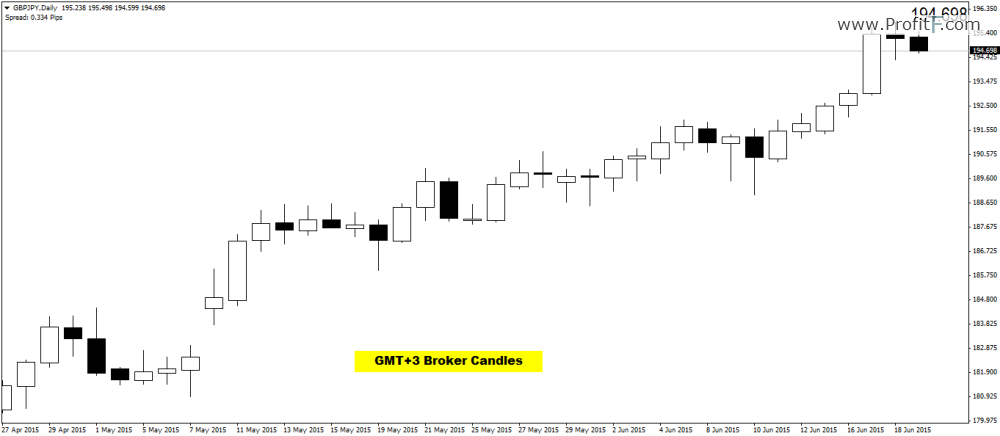
GMT+3 Broker without Sunday Candlesticks
GMT+2 (or +3 during European Summer DST): Forex brokers whose servers are based off GMT+2 (or +3) server time usually tend to offer 5 candlesticks during a week, representing 5 days of trading sessions in the week. Typically, GMT+2(+3) brokers follow the GMT timings of 5PM EST as the open and close of a new day’s trading session.
GMT: The GMT brokers tend to offer 6 days of candlesticks during a week, where the Sunday candlestick is also included. As can be understood, the GMT brokers have an additional trading session (i.e: Sunday) for the week. Of course, some brokers tend to offer GMT server time but exclude the Sunday candlestick in order to maintain a uniform, 5 day trading week.
Technically speaking, the only difference between these two types of broker server times is the difference on the way the daily candlesticks are calculated. However, if you shift to a lower time frame, the hourly and lower charts tend to be uniform as far as the candlesticks are concerned. However, the differences are noticeable when you focus on the daily or H4 chart time frame candlestick patterns.
In view of this confusion, a trader might often wonder whether they want to follow the candlestick patterns on the GMT broker or the GMT+2 broker. From a technical analysis perspective, traders should simply follow the sentiment offered by the candlestick patterns as they exhibit market sentiment irrespective of whether your broker’s server time is GMT or GMT+2.
In other words, a bullish engulfing on a GMT time zone based chart exhibits the same bullish sentiment as it appears on the GMT+2 time zone as well.
When in doubt as to which Server time your MT4 broker is following, a simple and easy way to find out is to click on the ‘View’ from the Main Menu and select ‘Market Watch’ or click ‘Ctrl+M’ to display the market watch window. On the top of this window, the broker show’s their server time.
The picture below shows a GMT+3 broker whose server time is shown on top of the Market Watch window.
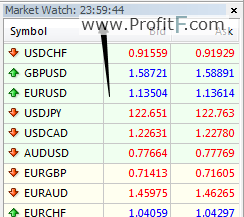
MT4 – Market Watch Tab, Broker’s Server Time
To compare the broker’s time to your time zone or to GMT time, the following resources could be helpful.
How to find out GMT offset your broker? – see difference between server time and GMT
Timezone MT4 indicator
The following free indicator for MT4 platform can be used to display the different time zones and the broker’s server time on the chart. (Download from here)
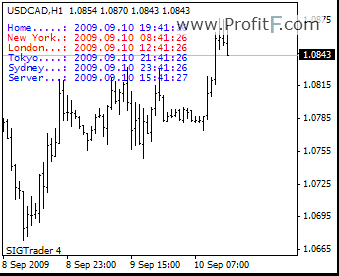
MT4 Time zone Indicator
From the above article, traders should be able to easily find out what time zone their broker is following and also be able to understand the differences between the GMT and GMT+2 candlesticks.
Add your review