Trading the Harmonic Bat Gartley Pattern
The Harmonic Bat is a variation to the Gartley pattern which was developed by Scott Carney. It is considered to be one of the more accurate patterns exhibiting a higher success rate than any other harmonic patterns. The bat pattern might look similar to a Gartley 222 Butterfly pattern but differs only minutely in terms of the Fibonacci ratios between the swing/pivot points.
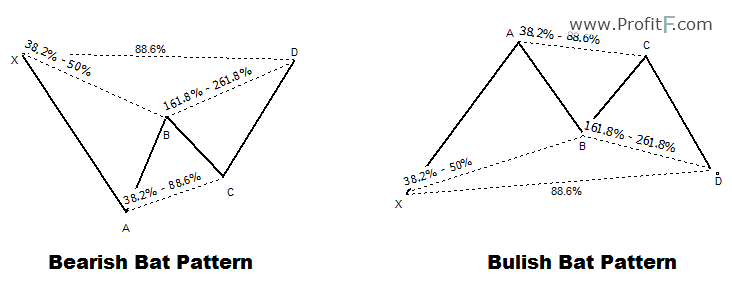
The Harmonic Pattern Bat is made up of 5 swing points, X,A, B, C and D and come in Bullish and Bearish bat variations.
The Harmonic Bat pattern has the following characteristics which can be used to identify the Bat pattern.
The chart below shows an example of the harmonic bullish and bearish Bat patterns.

The main difference between the Harmonic Bat and the Gartley 222 Pattern is the points or swing leg of AB.
| Gartley Pattern | Bat Pattern |
| AB must retrace close to 61.8% of XA | AB can retrace between 38.2 – 50% of XA |
| CD can retrace up to 78.6% of XA | CD can retrace up to 88.6% of XA |
| CD can retrace between 1.272 – 1.618% extension of AB | CD can retrace up to 1.618 – 2.618% extension of AB |
In terms of the target levels, the first target is set to 61.8% of CD, followed by 1.272% of CD and finally the projection of XA from D, the entry point.
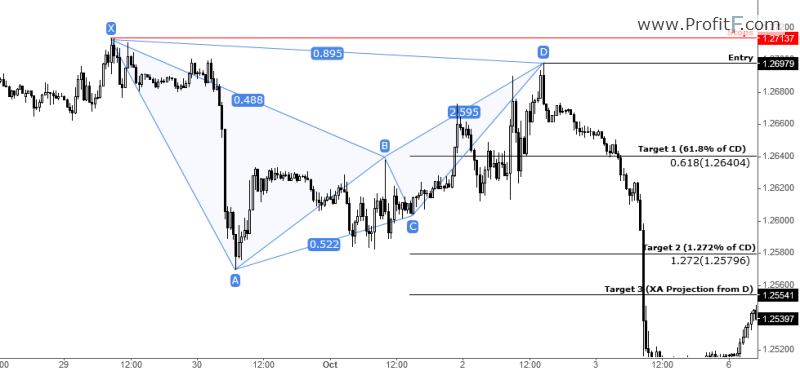
Bearish Bat Pattern Trade Example

The chart above illustrates an example of a bearish harmonic bat pattern which was executed perfectly.
After price rallied to point D, it promptly reversed. A short position would then be executed with stops near the high of X. The first target 1 comes in at 61.8% of CD, followed by target 2 at 1.272% of CD and finally target 3, which is the projected XA distance from the PRZ level at D.
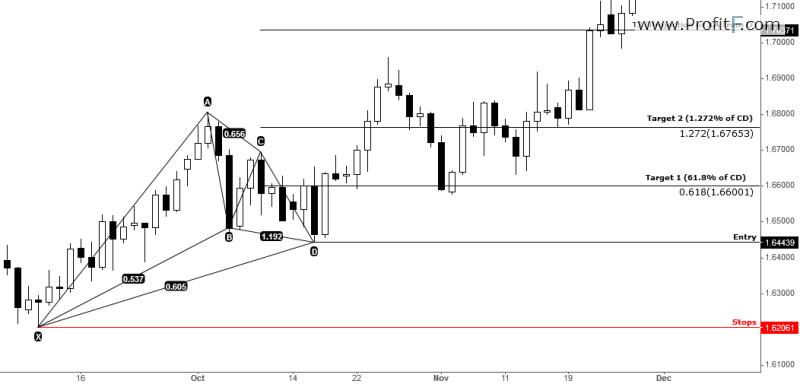
Bullish Bat Pattern Trade Example

The above chart shows an example of a bullish bat pattern.
In any case, price reversed near point D to reach all the three objectives of target 1 which is 61.8% of CD, target 2, the 127.2% extension of CD and finally target 3, the XA projected distance from the PRZ level at D.
From the above, we do notice that the Gartley 222 and the Bat patterns are almost similar with some minute differences as pointed out in the table. Traders shouldn’t really bother themselves as to the type of harmonic pattern that is being formed as the stop loss and target levels are the same as trading the Gartley 222 pattern.