The strategy is quite simple, so not only professional traders can use it, but beginners as well. You don’t need any complicated technical indicators: you only need a standard price chart and some attention. This strategy shows maximum efficiency on the Verum Option trading platform, as it offers user-friendly interface, numerous market assets, and « japanese candlestick» chart.
What is the essence of the strategy? It is to seize the moment of the strongest trend. If you get to know the price direction of a market asset for the nearest time, you can get profit with minimum efforts.
One of the most accurate and yet the easiest methods to forecast the price direction is to analyze four charts with different timeframes on the same asset:
М5 chart shows the closest perspective of the price movement, М15 chart shows short-term perspective, М30 chart helps to understand mid-term price direction, and Н1 chart shows long-term direction.
You can open charts sequentially, one by one. You can easily do so in the Verum Option trading platform by clicking the timeframe you need. or use our Live Forex Chart page
The essence of the charts is the last candlestick on every chart to be of the same color: green or red. That is, the signal to open a buying option is «twin» candlesticks on all 4 charts — all 4 candlesticks must be green. And to open a selling option, you need to make sure the last candlestick on every chart is red.
So why is it true? Because if we see the same trend (rising or descending) on every timeframe, it means the trend is quite strong, and we can make profit with no substantial risk.
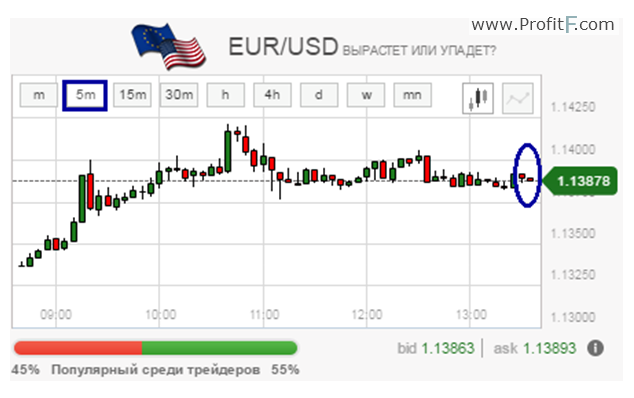
Let us consider an example. The screenshot below shows that on the EUR/USD M5 chart the last candlestick is red:

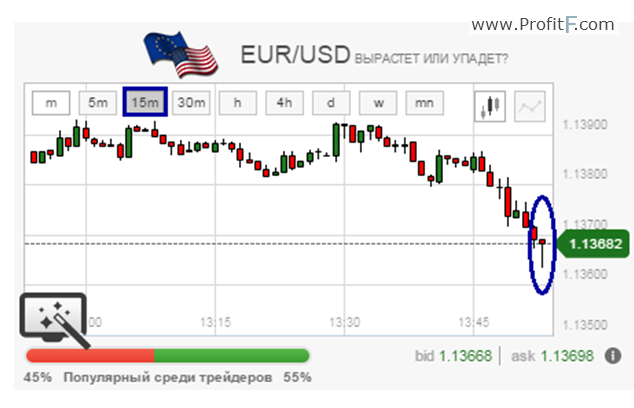
Then we open М15 chart, and we can see the candlestick is red as well:

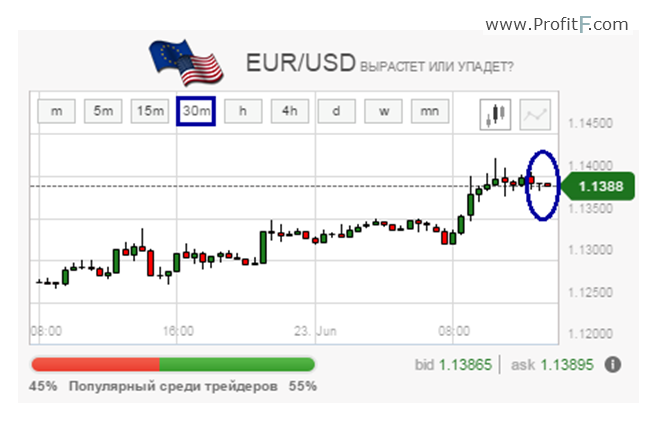
М30 chart shows the same data (the candlestick is red):

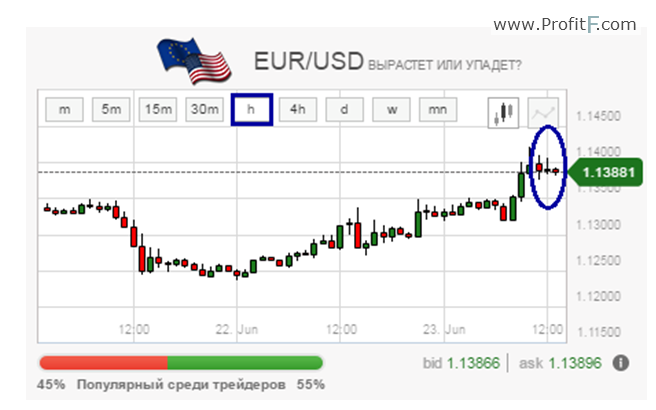
Finally, Н1 chart completely confirms the signal to open a «down» option — the fourth candlestick is red:

A position opened with such «bearish» signal has every chance to bring profit. In this way, you can profit from trading binary options fast and easy.