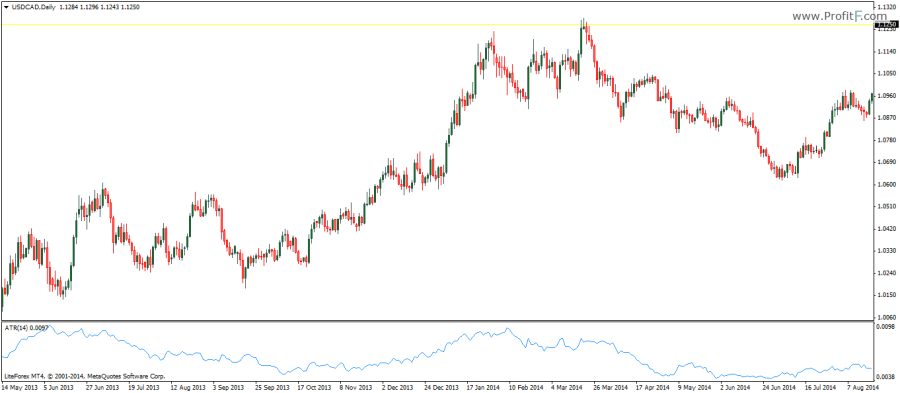
The Average True Range indicator or ATR oscillator is a very widely used indicator which measures the average range of the price bars over the specified period of time. The range here is calculated from the high to the low. The ATR indicator is used to measure the volatility of prices. Widening ranges point towards increasing volatility while narrow ranges or declining ATR values indicate consolidation or sideways markets.

The ATR indicator was developed by Welles Wilder in his book ‘New concepts in technical trading systems’. The default and common setting for the ATR is a 14 period look back period, besides other custom configurations such as 7 or 5 periods ATR depending on the time frame it is being used on. The indicator is calculated as the highest value of the difference between the high and low, previous closing price and the current maximum and the previous closing price to the current minimum.
The ATR tends to peak both at market tops and bottoms. It is therefore common to find the ATR being used especially to spot market reversals. Besides spotting market reversals, the ATR is a widely used component to set trailing stops and hard stops as a multiple of 2.
Download Average True Range indicator
Add your review