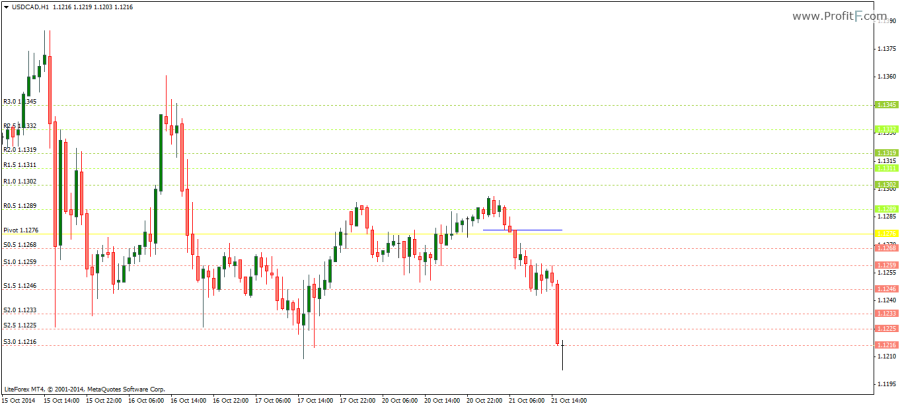
The pivot point support and resistance indicator are also referred to as the daily pivot points which is based on the concept of floor traders dating back to when trading was actively done on the exchange’s trading floors.
The Pivot point support and resistance levels comprises of the following 7 values: R3, R2, R1, Pivot Point, S1, S2, S3.
There are many different calculations to derive at the pivot points. The simplest of them being, calculating the average of yesterday’s daily price’s high, low and close. The R1, R2 and R3 values, also known as Resistance 1, 2 and 3 levels are then calculated as 2 x PP – Low, PP + (High – Low) and 2 x PP (High – 2 * Low).
Similarly, S1, S2 and S3 or Support levels 1, 2 and 3 are calculated as 2 x PP – High, 2 x PP – (High – Low) and 2 x PP – (2 * High – Low).
Besides the above pivot point calculation, other variations include:
The support and resistance levels 1, 2 and 3 indicate the day’s potential reversal levels but that is not to rule out the fact that price an sometimes break above R3 or below S3 when the volatility is extreme.

The pivot points can be calculated based on daily charts as well as weekly and monthly price charts. When combined with other indicators such as moving average or oscillators, the pivot points can form a useful trading system.
Download Pivot point support and resistance indicator
See LIVE Pivot Point Levels in ProfitF – Tools section
Dude, this is default MT4 indicator, so I think this pivot indicator designed for these timeframes….maybe for daytrading. If you’d like to see pivots lines on higher TF I think you need use other “Pivot Point support-resistance indicator”
Doesn’t work on the higher TF 4h, day, week. Shame really.