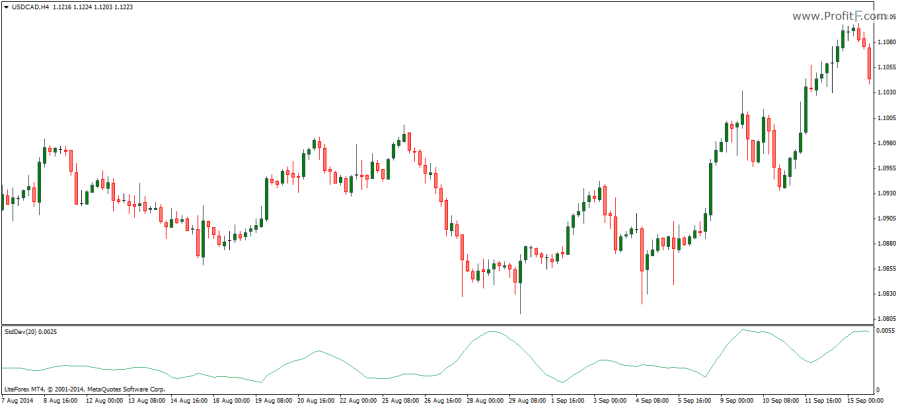
Standard Deviation indicator (StdDev) – indicator to measure volatility plotted as an oscillator. The standard deviation indicator plots the price changes in relation to the moving average. The default setting for the standard deviation indicator is 20 periods look back and can be changed to any of the four types of moving averages to be compared to.
The Bollinger Bands indicator makes use of this standard deviation values when plotting the upper and lower bands. Therefore, the Standard Deviation indicator is also commonly used with Bollinger bands as well.

Besides the above, the Standard deviation indicator can help in anticipating potential volatility movements in the market. When the Standard deviation indicator is low or flat, a period of highly volatile market movements can be expected while when the Standard deviation indicator is high or at the extreme, it points to a period of calm or low volatility in the markets. The standard deviation indicator can be especially useful for trading break outs as well as trading the reversion to the mean concept of trading. The sensitivity of the Standard deviation indicator can be changed by lengthening or shortening the Standard deviation periods
Download Standard Deviation indicator
Add your review