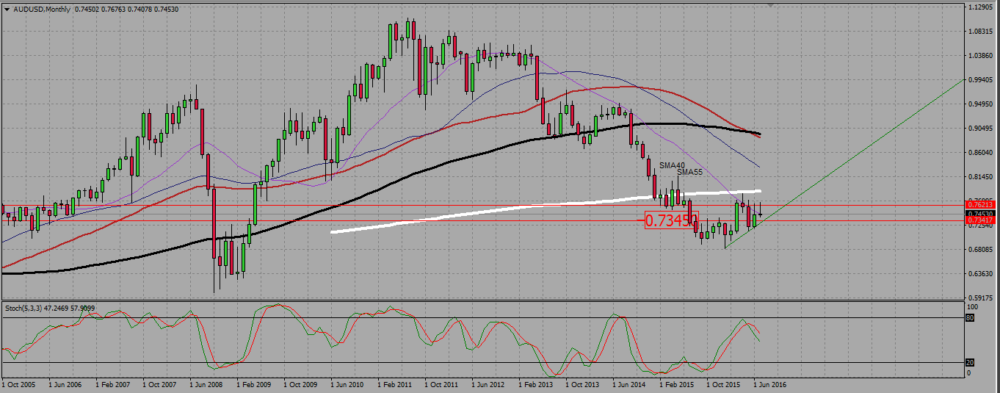
Under 0,76, sell signals toward 0,735 – 0,733.
On the monthly chart, the aussie is ranging. The current monthly candle is a gravestone doji, just under a resistance near 0,76. The previous candle -June-, failed to break that resistance. If the pair cannot go up, the only way that remains is down.
AUDUSD MONTHLY CHART.

The weekly chart is clearly a down trend, and there is a evening doji star pattern, therefore a bearish configuration. The pair will probably keep going down to retest 0,7325 0,735, where an horizontal support line is located, with also two SMAS -40 and 55- near by.
This is why under 0,76, I will look to sell tha pair towards that 0,733 support.
AUDUSD WEEKLY CHART.

Add your review