EURUSD trading plan.
Buy signals above 1,11 long term, but watch for the resistance at 1,145 . Under 1,11, sell signals towards 1,0825.
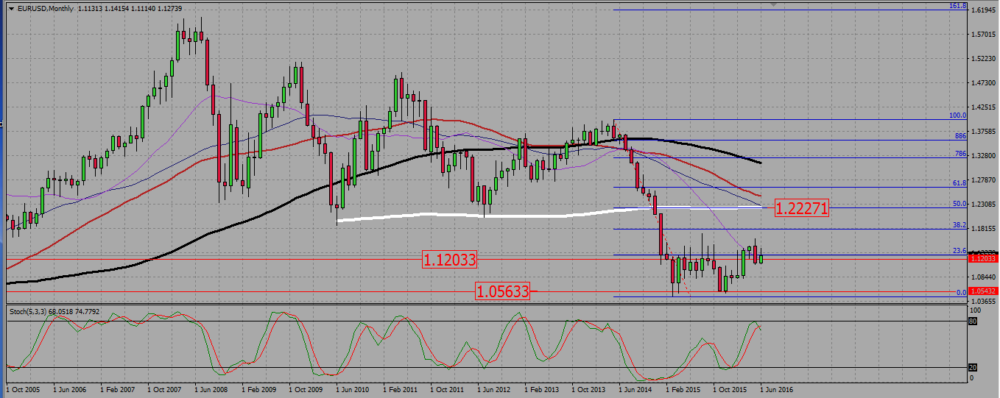
On the monthly chart the euro has been ranging since March 2015th roughly between 1,05 and 1,12. The many up wicks we see over 1,12 show the pair is trying to break up that resistance, but it did not manage until March this year where it finally closed above 1,12. Then after an indecision candle in April, the pair came back to retest that 1,12 level in May. The current candle -small bullish candle with an upwick- shows we are still in the middle of that process.
EURUSD MONTHLY CHART.

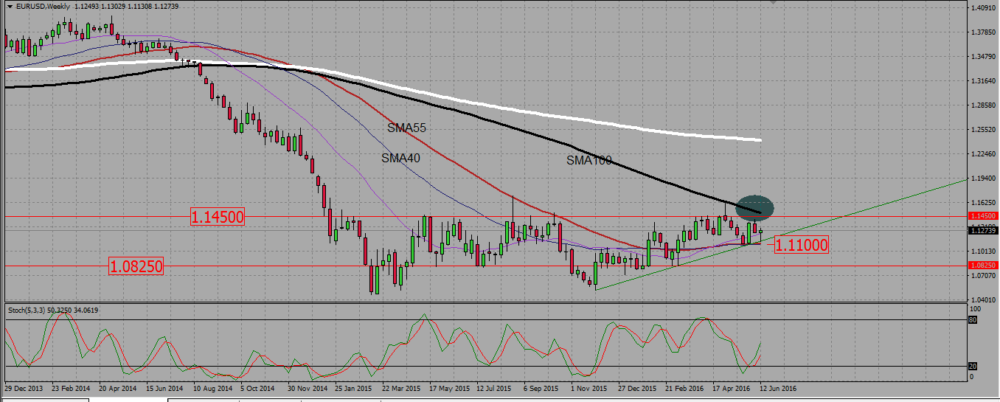
The weekly chart gives us lot of information.
First on the support side. The pair is consolidating up, over a support trend line -drawn in green-. That trend line has just been retested this week, and the rejection of that TL looks weak; if any, the rejection candle looks even like an indecision. That support trendline is currently located near 1,11, with two SMAs -40 and 55- at the same level and adding weight to that support. This will therefore be our last line in the sand to keep a bullish bias. Under it, I will rather look for selling signals towards the support we see at 1,0825.
Secondly on the resistance side, where we may draw an horizontal resistance line around 1,145. In fact, together with the support trend line, this is a bullish triangle. Please take note of the 100 SMA pointing down and getting very close to the 1,145 resistance. As this SMA rejected the pair last time the euro tried to rise, this 1,145 level is to be taken very seriously. Do not buy the pair just under it.
EURUSD WEEKLY CHART.

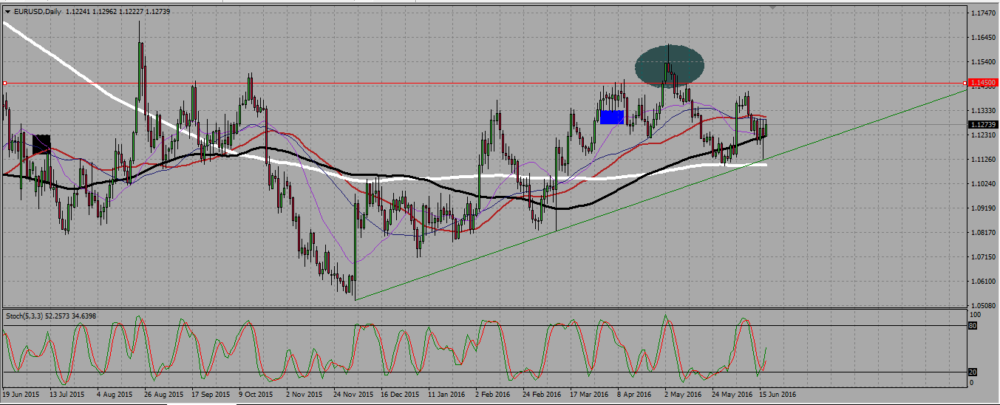
The daily chart shows the pair consolidating within the bullish triangle we identified on the weekly chart. The SMAs are getting bullish, and this is why I prefer to buy signals as long as we remain above the support trend line. Price action reveals however lots of indecision and you should take only very good signals, allowing for a break down-pull back-confirm configuration. The grey ellipse just shows you what may happen when you enter on a simple break out, not waiting for a retest.
EURUSD DAILY CHART.

Add your review