1-EURUSD trading plan.
Above 1,10 buy signals long term. Under 1,10, sell towards 1,0825.
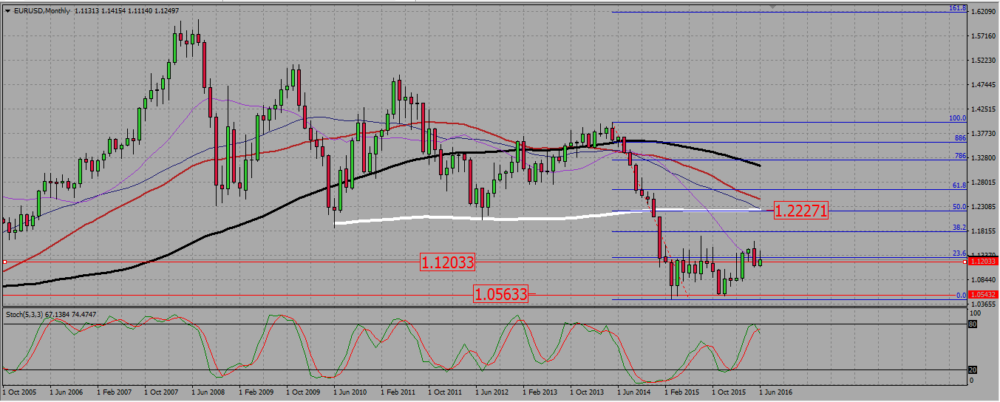
On the monthly chart, and between March 2015 – March 2016, the pair traded in a range, from 1,05 to 1,12. On March 2016, it closed for the first time above the resistance above 1,12. However, the euro is having troubles to keep going up, and last month’s candle was a bearish engulfing one. The pair seems to be willing to go down again.
EURUSD MONTHLY CHART.
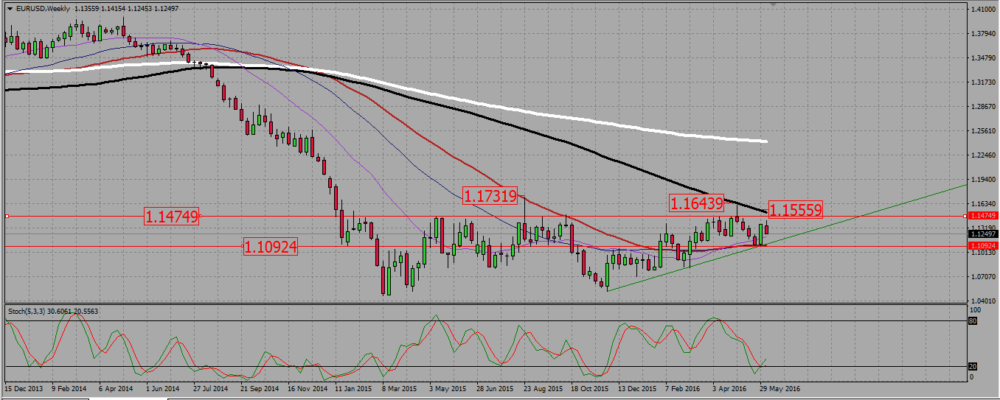
On the weekly chart, the pair stays more or less within a bullish triangle, with a resistance near 1,1475 and a support trend line drawn in green. As long as the pair does not break down that support trend line (currently around 1,11, with the 40 and 55 SMAs approximately also at this level), I prefer to biy signals. We may also see on this graph that since the pair reached a low around 1,05, it has been slowly consolidating up. A retest of the support trend line is very likely, but as long as this support holds, I do not feel comfortable selling the eurodollar.
EURUSD WEEKLY CHART.
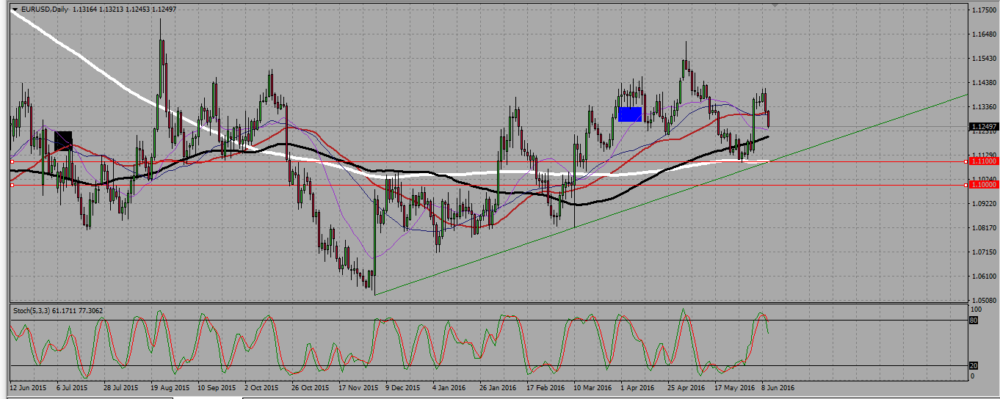
On the daily chart, we see that the bullish consolidation is indeed in trouble. The pair rejected a resistance zone around 1,135 -1,145 -above the blue box-, then stopped making higher highs and higher lows, and looks like it is now making lower highs. Another cause of concern is that the two last candles are solidly bearish. Those candle are not strong enough to negate the the bullish candle that happened post NFP last week, but are solid enough to suggest the bearish move is not over. However, and above 1,10, I prefer to buy signals as the 100 and 200 SMAs suggest the euro still wants to go up. But should 1,10 be broken down, I will start looking for selling signals.
EURUSD DAILY CHART.
2-USDJPY trading plan.
Watch the 105,5 -105 support area, but the bears seem to be in firm control of that market, and I think that support will eventually be broken down. Selle signals under 111,5. Eventually buy signals near 105,5 – 105, but do it very cautiously.
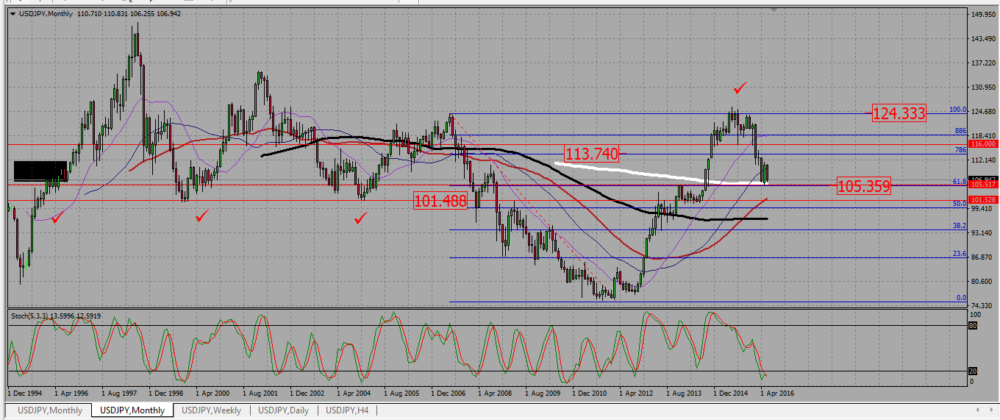
On the monthly chart the pair was in an uptrend until July last year, where it gave a hanging man and started to go down. In April/May this year, it reached and then rejected a support near 105,5. However, this rejection does not seem to have a lot of strength in it: as after 10 days, the previous month candle has already been negated. The pair is now retesting the 105,5 support zone . If it it breaks, the next support line is located near 101,5.
USDJPY MONTHYLY CHART.
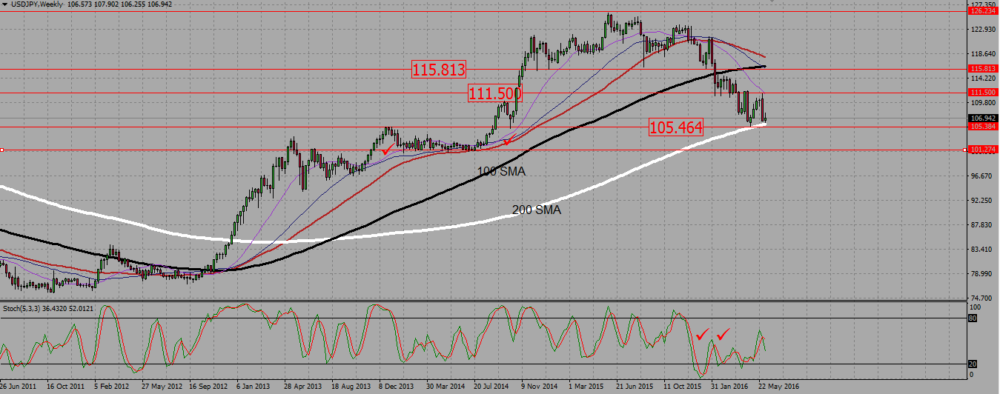
On the weekly chart, we see that the current bearish consolidation is quite strong. Since the pair broke down a support around 111,5 by the beginning of April, the bearish candles are stronger and bigger than the bullish ones : the bears are in control of that market. Even when the pair rejected the 105,5 support line, it went up by three medium bullish candles, only to get crushed down back to that support line in just one week.
This support around 105,5 105 is strong, but the bears are so in control of the market that i do not think it will hold. In such a case, I will not enter on the first break down, but allow for some pull back towards that broken support and enter with a new selling signal.
USDJPY WEEKLY CHART.
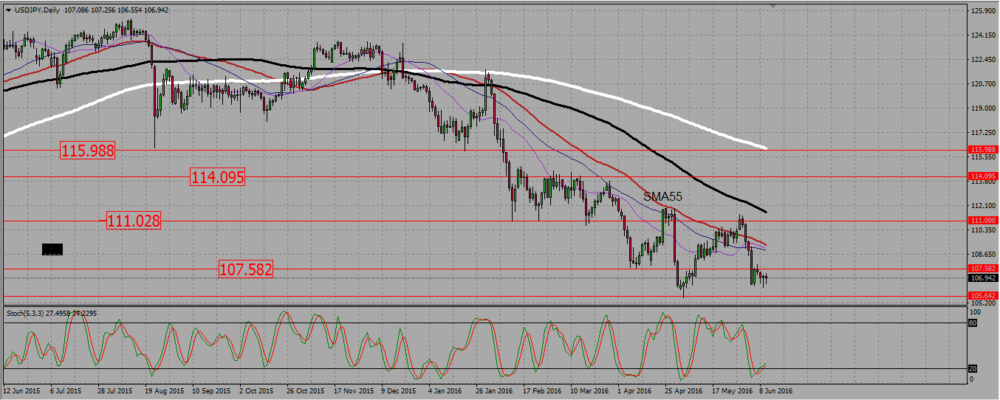
Finally the daily chart shows a classic downtrend scenarios : parallel SMAs, lower highs and lower lows. The pair somehow bounced from 105,5, but could not find the strength to make a new, higher high. It failed to break a resistance around 111, and went back down to retest the support around 105,5. Considering that this market is currently a bear territory, I do not plan to buy a bounce from 105,5, unless it is a very strong signal, but rather expect that support to be broken.
USDJPY DAILY CHART.
3-USDCAD trading plan.
As long as the pair does not break down the weekly 100 SMA, currently around 1,25, buy signals long term, for the loonie is in a monthly support area. Sell confirmed break of the previous low around 1,245.
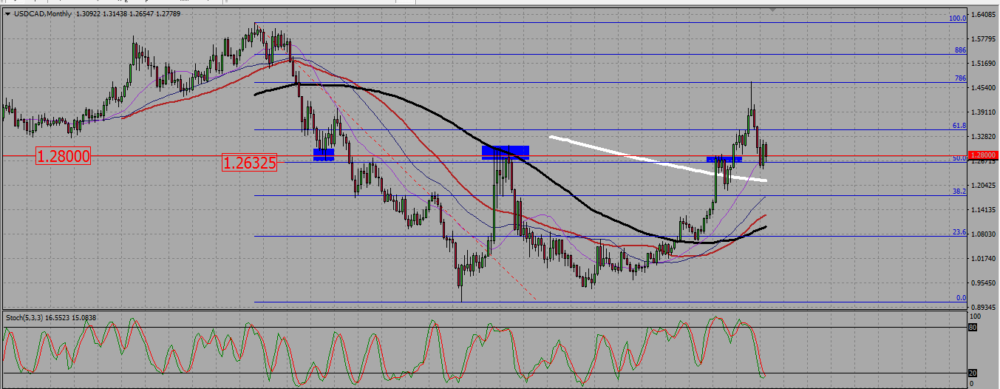
On the monthly chart, May candle is a bullish engulfing one, in a context where most SMAs are pointing up, indicating an uptrend. Even if we are starting the month with a bearish note, I prefer to buy signals as long as we are above the support zone around 1,2623. In such a case, I will try to trail my stops in the hope the pair resumes its bullish journey.
USDCAD MONTHLY CHART.
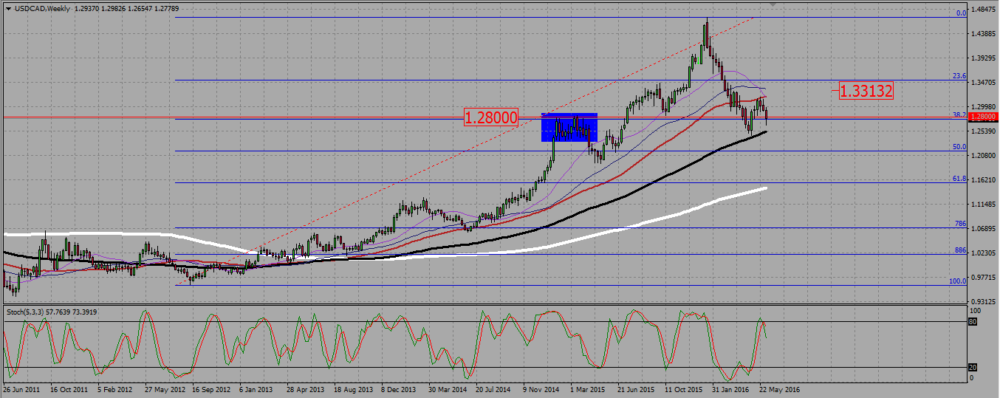
The weekly chart also shows an uptrend. We see the pair rejected the 100 SMA support around 1,245 with a bullish engulfing candle, but is now coming back down, and may be will retest it once more. But ss long as the pair does not break down that 100 SMA, it makes more sense to buy signals on that pair. However, a confirmed bearish break down of the 100 SMA would be a valid signal to sell the loonie, and this may happen if oil prices start to rise.
USDCAD WEEKLY CHART.
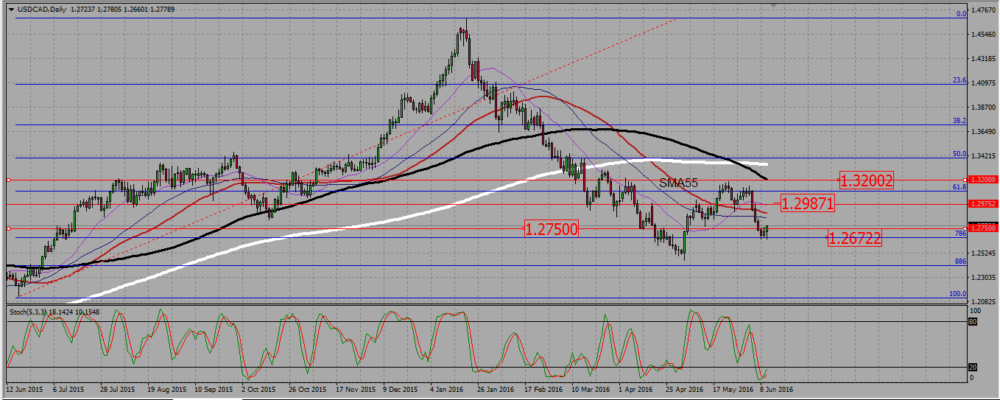
The bullish trend that was visible on the weekly and monthly chart is not that obvious on the daily chart, as we see short term SMAs pointing down. The pair however managed to break up a resistance around 1,275, meaning the bulls are fighting to take back the control of that market. Combined with the uptrend we may see on larger time frames, this makes me wishing to buy that pair rather than to sell it.
USDCAD DAILY CHART.
Add your review