1 – EURUSD trading plan.
Under 1,145, sell signals on resistances towards 1,115, 1,0825, and lower. Buy confirmed breakout of 1,145, or reversals around 1,115 and 1,0825. 1,133 – 1,145 is a no buy zone.
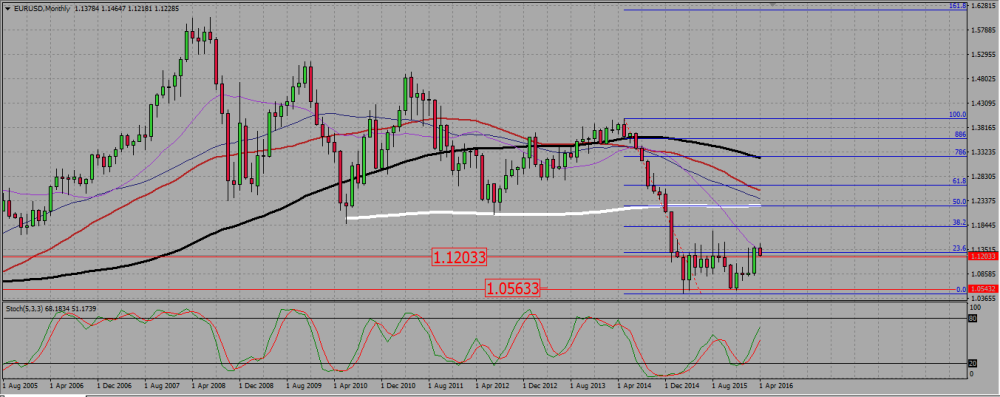
On the monthly chart, and after breaking a monthly resistance around 1,12, the pair is coming down to retest it, but there is a 23,6 Fibonacci resistance level in the area. It is too early to say whether the euro is retesting a broken range resistance -and will go up- or merely rejecting a Fibonacci resistance -and it will go down-.
EURUSD MONTHLY CHART.
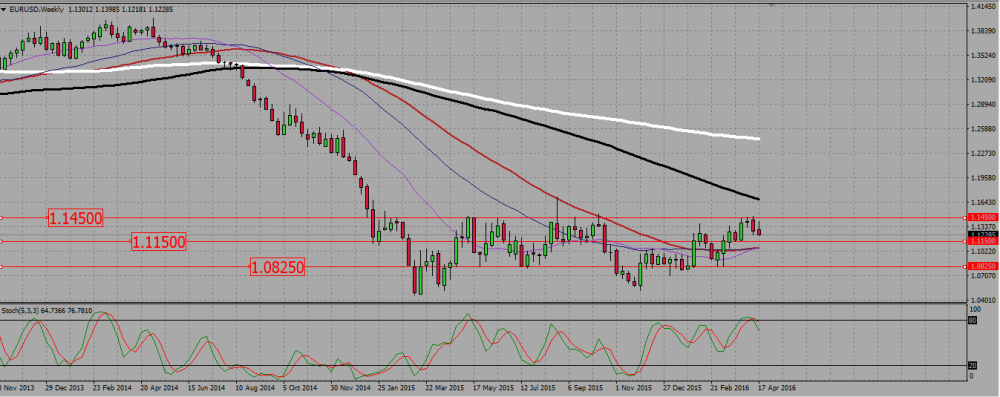
On the weekly graph, the EURUSD is in a ranging mode, after a strong bearish move. 1,145 is a key level resistance, for the pair keeps hitting it and then reversing. I will monitor price action there to buy or sell signals. There are two support lines, the first at 1,115, and then the next one around 1,0825. I will be also watching price action around those supports ready to sell a breaking down or to buy a reversal.
EURUSD WEEKLY CHART.
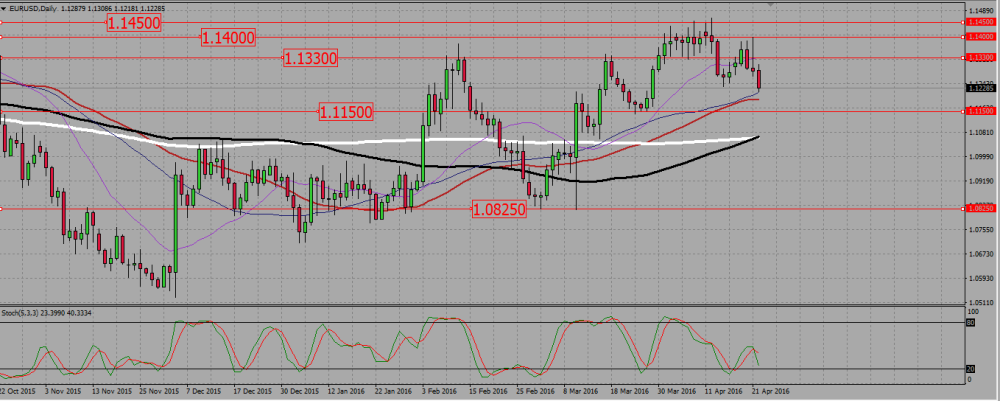
The daily chart is very interesting. It shows that after the pair rejected the resistance around 1,145, it made a few high wave candles, ranging between 1,145 and 1,133. then it sharply broke the support around 1,133, but could not get rally lower lower. It U turned around 1,125, then re entered the 1,133 – 1,145 range, but did not make it up to the resistance. It was stopped around 1,14, plunged back again, and ended the week even under the 1,125 level that held last time as a support.
Therefore I think we are going down, and I will be only looking to sell the euro as long as it is under 1,145. The levels at 1,125 and 1,133 have been broken several times, and may now be considered as secondary; I will certainly not buy any signal at those levels.
EURUSD DAILY CHART.
2-USDJPY trading plan.
Watch the 109,75 level, and buy any breakout for a renewal of the bullish long term trend, aiming at 111,5 and 116 at first. Sell break down towards the next big support around 105,5. The very big bullish daily candle on Friday suggests we will go up.
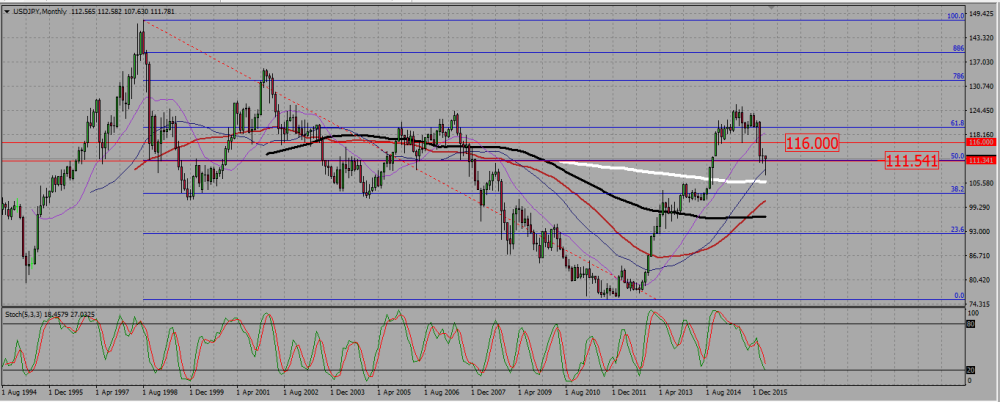
On the monthly chart, the USDJPY has been consolidating down since July last year, and seemed to be heading towards a strong support around 105,3, but this month candle just looks like a hammer rejecting a Fibonacci support. But the month is not finished, and we need to wait one more week to see that candle’s final shape.
USDJPY MONTHLY CHART.
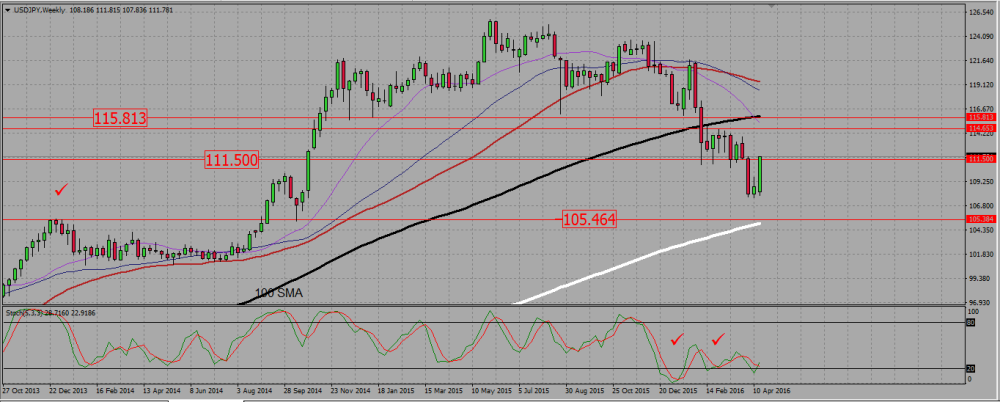
On the weekly chart, we are in the bearish consolidation of an uptrend. The pair just completed a bullish Harami, and the last part of it looks like a bullish engulfing candle. As a matter of fact, it it the strongest weekly bullish candle since the bearish consolidation begin last July. The pair now stands near a weekly range support/resistance level near 111,5.
USDJPY WEEKLY CHART.
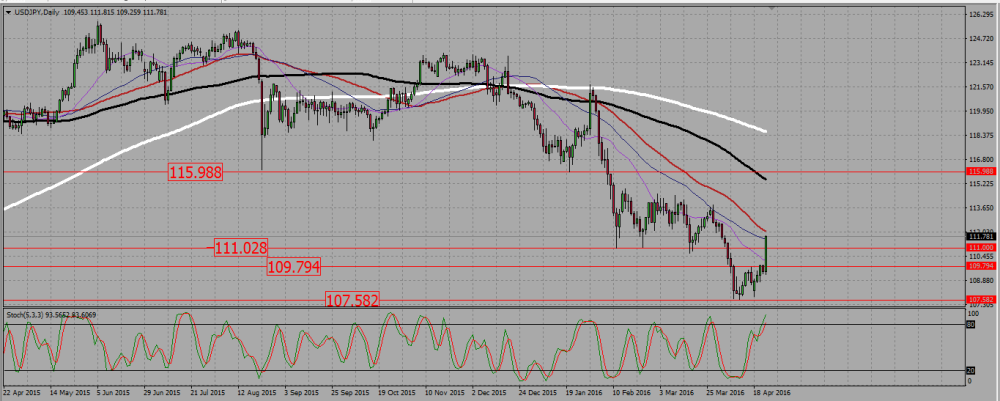
On the daily chart, we see a huge bullish candle on Friday, that confirmed an inverted head and shoulder. We must wait to see how the week will start, but above the broken resistance at 109,75, I will only buy signals.
USDJPY DAILY CHART.
3-USDCAD TRADING PLAN.
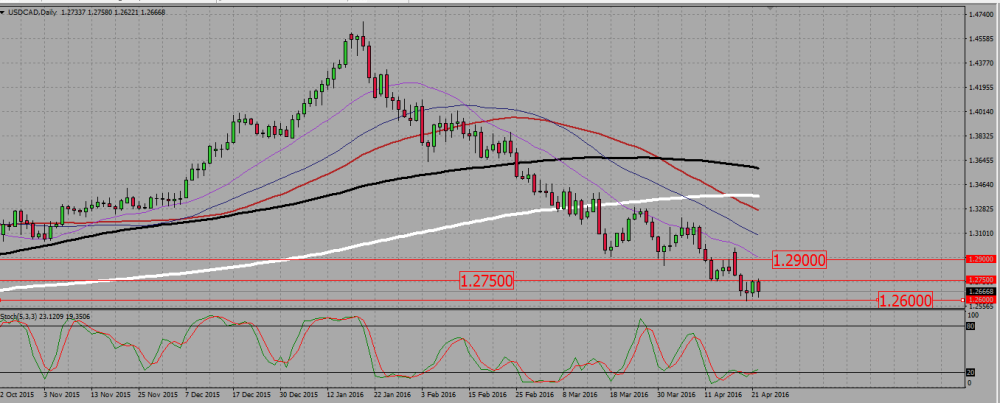
The loonie looks very bearish, but it is just above a strong monthly support zone. Watch out price action at 1,26, and sell a confirmed break out of it, but you may also buy a reversal at that level; or if you wish to play it more safely buy a breaking up of 1,275. Long term SMAs on the weekly chart suggests a long term bullish trend.
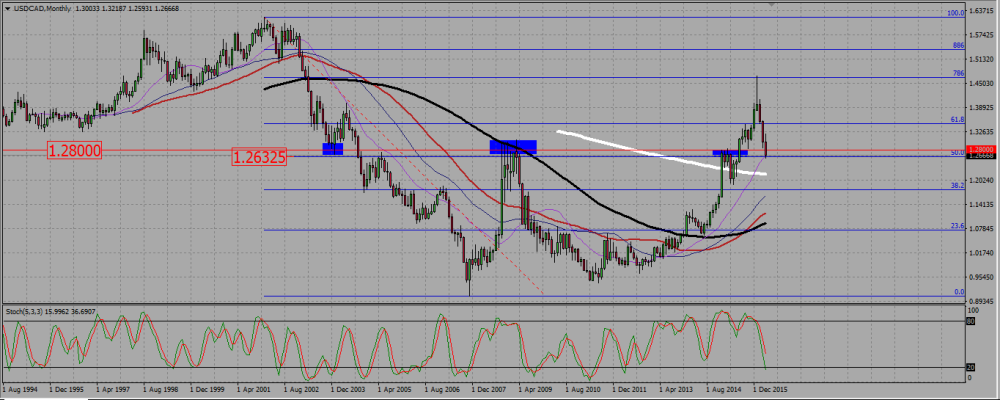
On the monthly chart, the pair is sharply going south, but it is entering a strong support zone between 1,28 and 1,26.
USDCAD MONTHLY CHART.
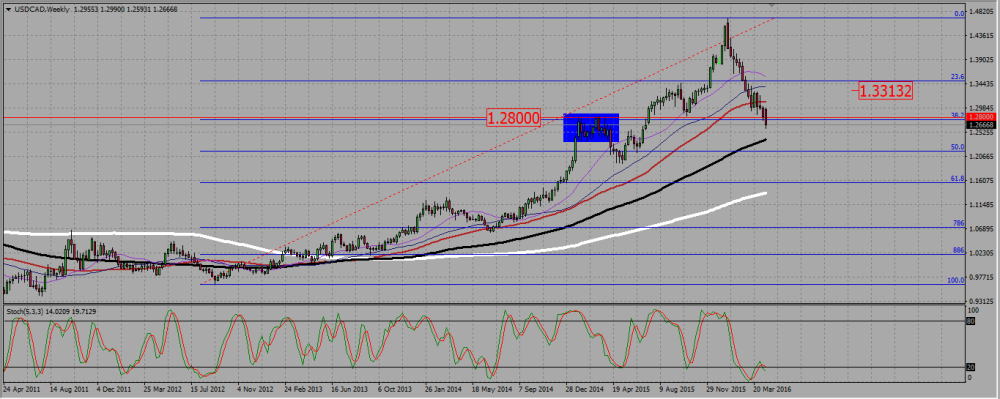
The weekly chart shows a very strong bearish consolidation, but the pair is entering a support area (blue box). It broke a support near 1,28. Long term SMAs are pointing up.
USDCAD WEEKLY CHART.
The daily chart is a clear downtrend, but rememberthe loonie is just above a monthly support around 1,26,and there is an indecision candle on Wednesday that forms a morning star with the two candles around it. That potential bullish reversal pattern has not been confirmed, as Friday candle is a bearish one, and it looks like the pair is going to retest the support at 1,26, but remember this is a monthly -strong- support. I will sell confirmed break out of it, but also buy signals at that level, for the risk/reward ratio would be excellent. A safer approach would be to wait for a breaking out of the 1,275 resistance to buy signals.
USDCAD DAILY CHART.
Add your review