FREE – Subscribe to this Forex analysis via Email
EURUSD trading plan.
That pair has been going nowhere since the British referendum, but last week Fed decision on keeping rates unchanged may have been a kind of wake-up call. Above 1,1075 – 1,11, buy signals towards 1,13 and 1,14.
EURUSD ends the month with the weak rejection of a monthly range support near 1,09, the range resistance being around 1,14. July candle is an indecision, with a hammer like figure except there is no previous trend. Nonetheless it is a bullish candle, meaning the pair managed to slightly go up during this month.
EURUSD MONTHLY CHART.

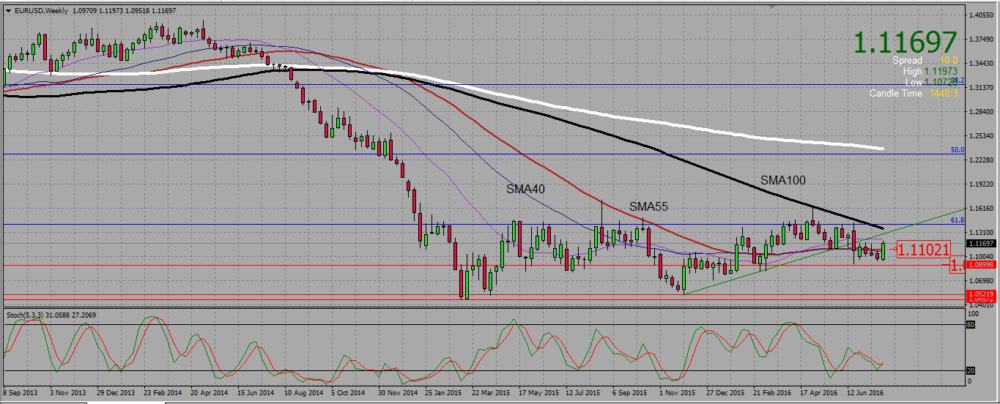
The situation looks clearer on the weekly chart. There is a bullish engulfing candle, and the stochastic oscillator gives a buy signal. It seems EU has decided to go and test the monthly resistance near 1,14. But on its way up it will meet the descending 100 SMA, that already twice blocked it on its way up. That SMA is furthermore getting close to a rising support trend line, and together they may meet the pair on its way up near 1,1325 – 1,135. Do no forget to monitor price action in that area.
This week candle broke up a SMA confluence -with the 55 and 40 SMAs- near 1,111. As long as the pair remains above that level, I prefer to buy it, but should that support be broken down, EURUSD may retest the 1,09 support for a third time.
EURUSD WEEKLY CHART.

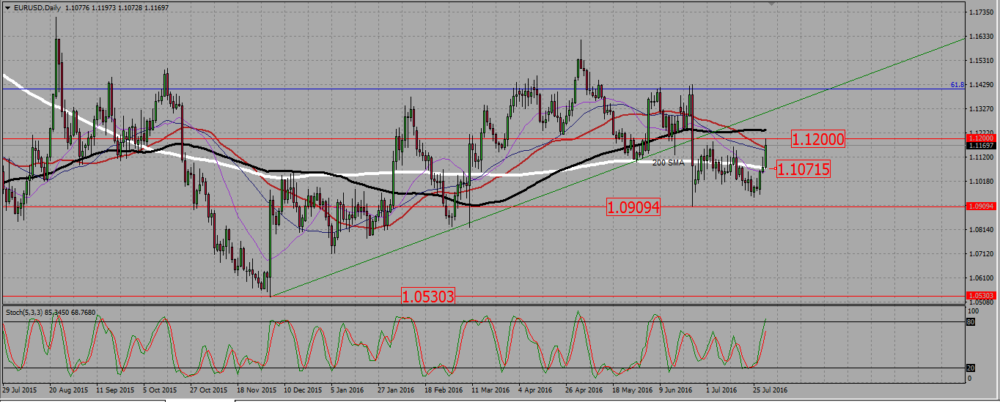
On the daily chart second half of the week price action is the thing to pay attention to. Following the FED decision, the pair broke up the 200 SMA around 1,1075 (very close to our weekly SMA confluence), then retested it on Thursay, to confirm the break up on Friday with a new high. This is very bullish, except that the pair is entering a resistance area, and that we are in the middle of summer, a time where strong trends are rather the exception. Therefore wait for a pull back before entering a long trade.
EURUSD DAILY CHART.

Add your review