Watch 1,09 for a confirmed bearish break out towards 1,05 and then potentially 1,01, or for a bullish reversal towards 1,1175 and then 1,14. In that case, mind the h4 200 SMA resistance near 1,1075.
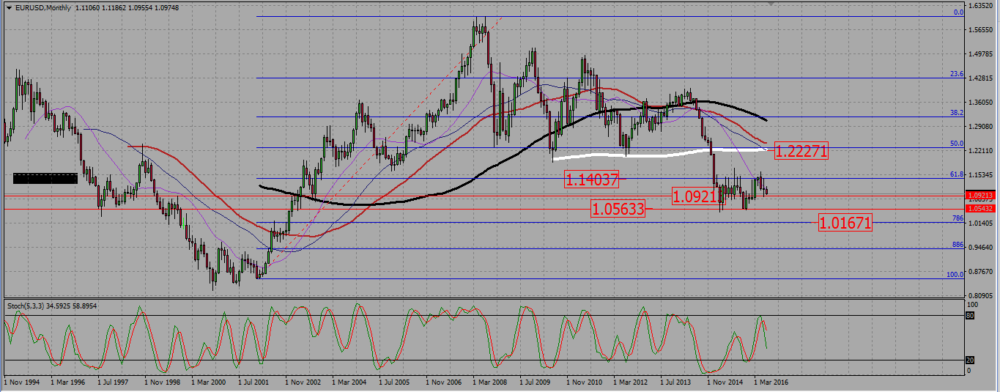
On the monthly chart the pair is ranging, roughly between a resistance near 1,14 and a support near 1,05 . It is now going down after rejecting the resistance at 1,14, but getting very close to a inner support near 1,09. As there is no clear trend on that chart, we need to refer to shorter time frames to assess how strong this 1,09 support may be.
EURUSD MONTHLY CHART.

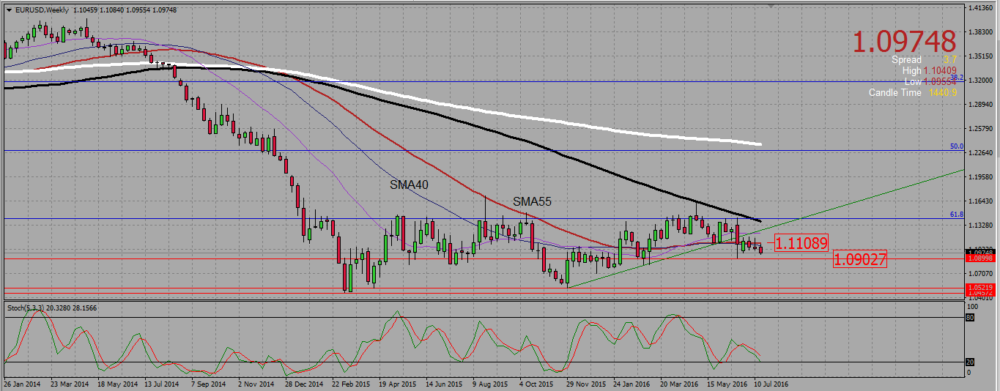
On the weekly chart the 200 and 100 SMA are going down, while shorter terms SMA are messy; we are in a consolidation phase following a bearish trend.
During that move down, the pair consolidated in a bullish triangle for a while, to break it down post Brexit. Since then, EURUSD is going nowhere: the three next candles are small, and all within the bigger Brexit one.
Within that bigger candle, the pair could not broke a SMA conjonction near 1,111 and is slowly drifting south. It will probably retest the post Brexit low- 1,09-, but that move south is very weak, and we will need a very clear signal to enter any trade, in one direction or the other.
EURUSD WEEKLY CHART.

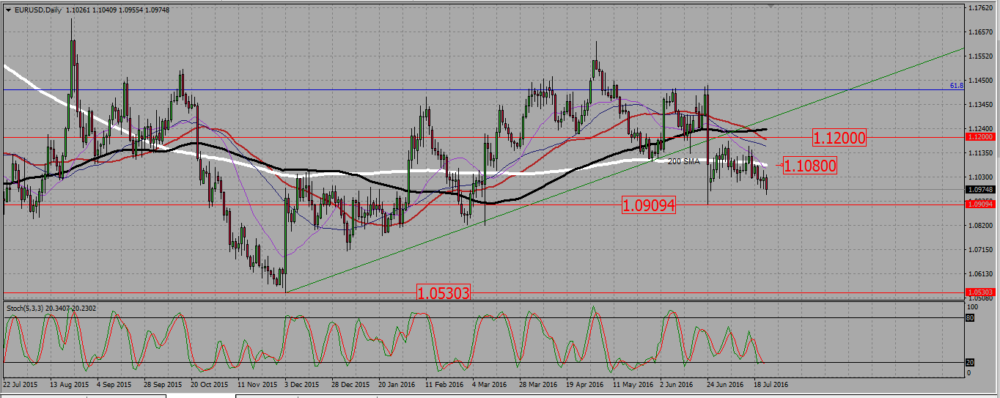
The daily chart shows what happened post Brexit: it is just a mess of up wicks an down wicks, reflecting indecision . There are however two elements worthy of note:
1-Bearish candles look stronger than bullish ones; it is safer to short a pull back to a resistance than to long a reversal from a support.
2- The 200 SMA is a natural support/resistance area. That SMA is flat to slowly going down, and is now located around 1,1075- 1,108. Look for short time selling signals there.
EURUSD DAILY CHART.

Add your review