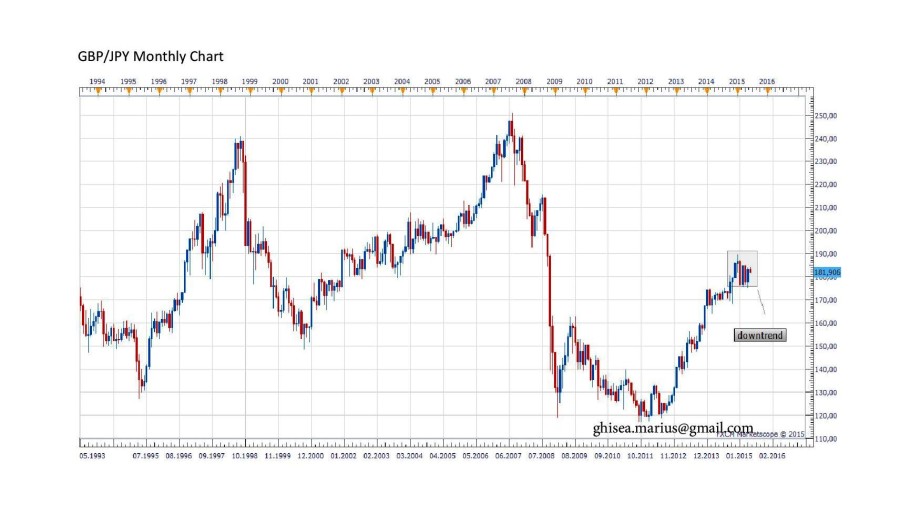
The daily chart for GBP/JPY indicates that this pair will be soon in downtrend. The entry point will be at 61% Fibo where is 181,14 level. GBPJPY will fall in the long term in order to close the gap at 167,89. At this level will be formed a triangle.

The monthly chart will be correlated with the daily chart when the price reaches the entry point. This pair will be in downtrend in the long term.
