TABLE OF CONTENTS:
Colors for Support, Resistance, Trend Lines: Monthly, Weekly, Daily
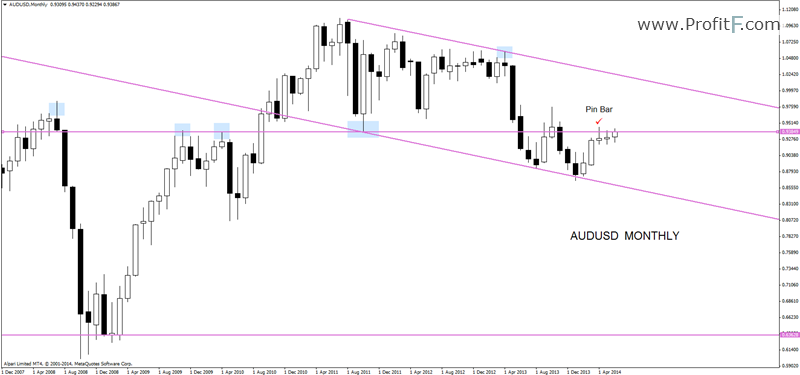
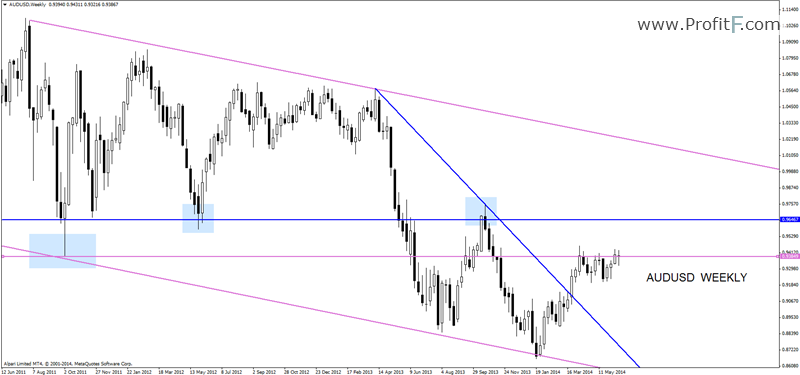
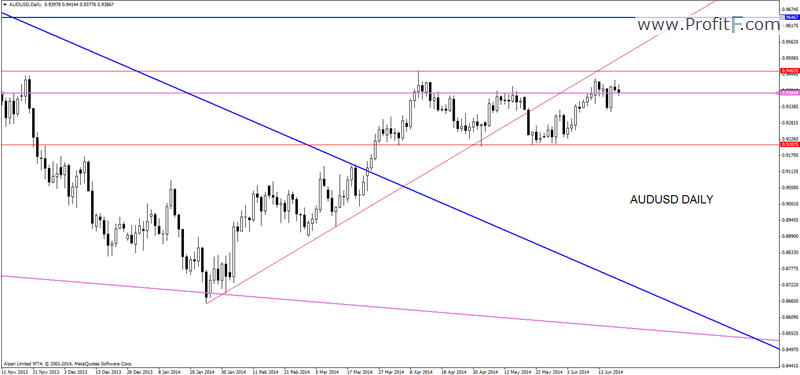
Commentary: On Monthly chart (TimeFrame-MN) price is inside the white pinbar, this month we need to see where price can go. AUDUSD is in consolidation for few days. Pair is still around monthly pivot.
Key levels to watch are 0.92 and 0.947.
0.92 level is a good place to open short trade. If price finally break 0.92 level, the pair can make a pullback to this level before go down. We’re still bearish on AUD/USD. Waiting breakout 0.92 support. Watch PA signals on 0.92 levels
————————————————
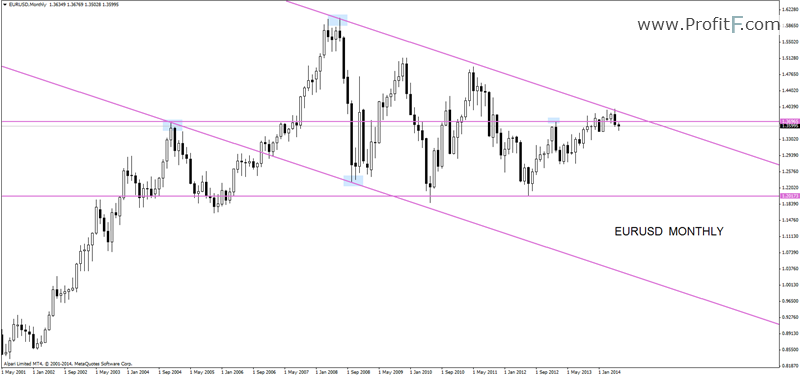
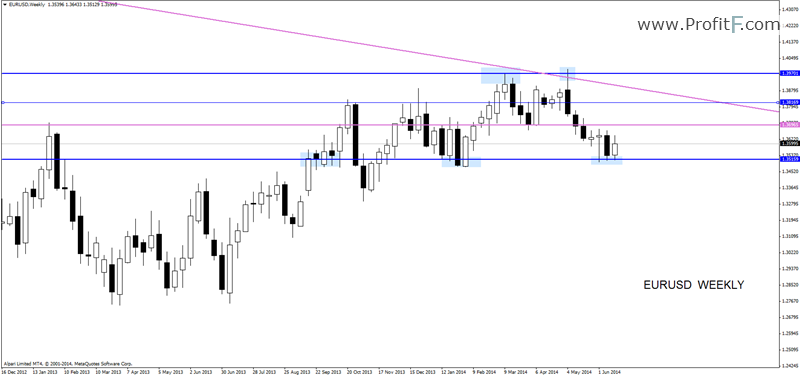
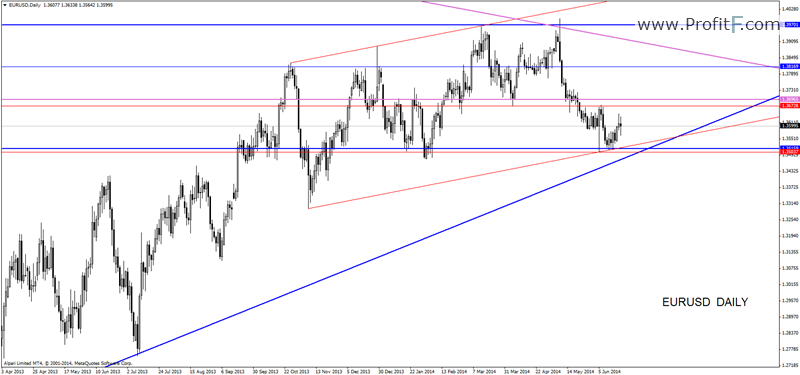
Commentary: On Monthly chart (TimeFrame-MN) price is inside the channel. On Weekly chart (TimeFrame-W1) EURUSD is in inside the pinbar.
Key levels to watch are 1.35, 1.367, and 1.381
1.35 is a good place to sell stop order
1.367 and 1.381 – levels where we’re looking PA signals. We will search for sell opportunities.
————————————————
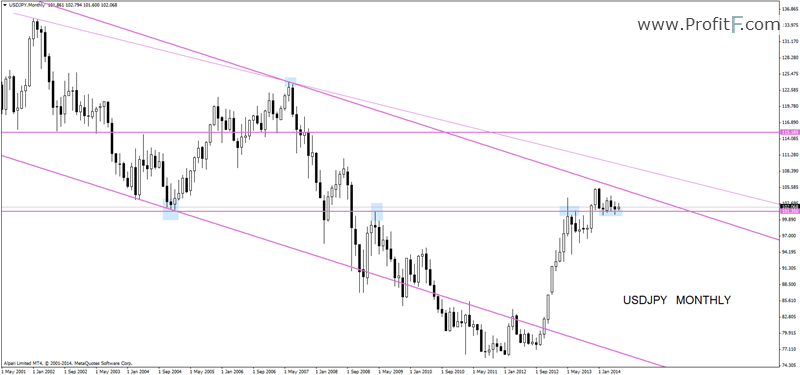
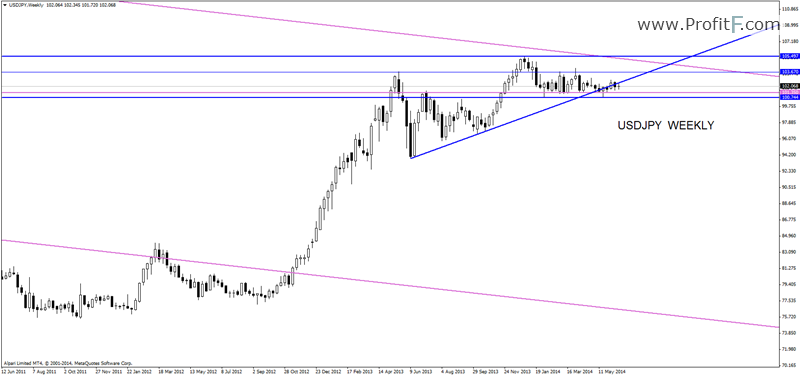
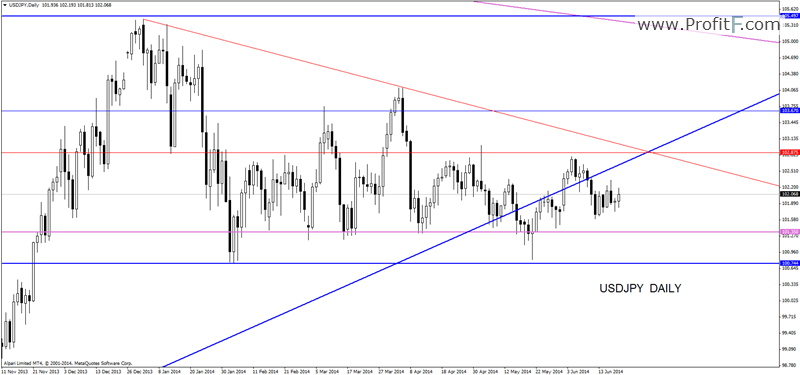
Commentary: On Monthly chart (TimeFrame-MN) price is inside the channel. On Weekly chart (TimeFrame-W1) USDJPY pair still around weekly trend line. Daily chart offers several areas of resistance. We see price under weekly trend line (blue line), daily trend line, daily resistance level.
Key levels to watch are 102.8 and 100.8
If price will touch weekly trend line near daily resistance levels ( horizontal level at 102.8 or daily downtrend line) we will search for sell opportunities.
After the breakout support level at 100.8 probably nothing will hold the price. That’s a good opportunity to follow the down trend.
————————————————
Add your review