TABLE OF CONTENTS:
Colors for Support, Resistance, Trend Lines: Monthly, Weekly, Daily
Helpfull links: Real Time Forex Charts (Live), Forex Economic Calendar news (Live)
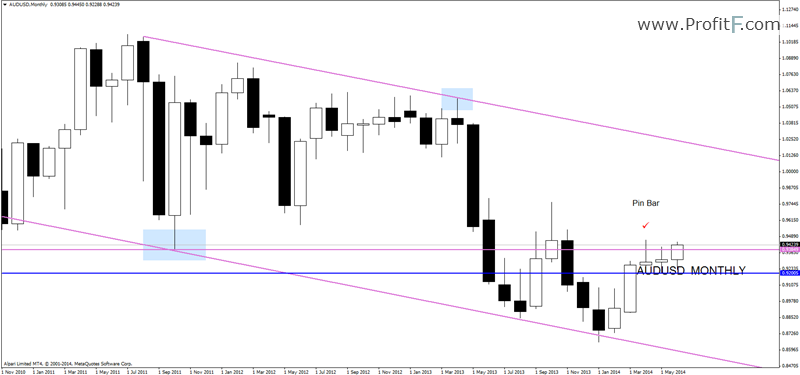
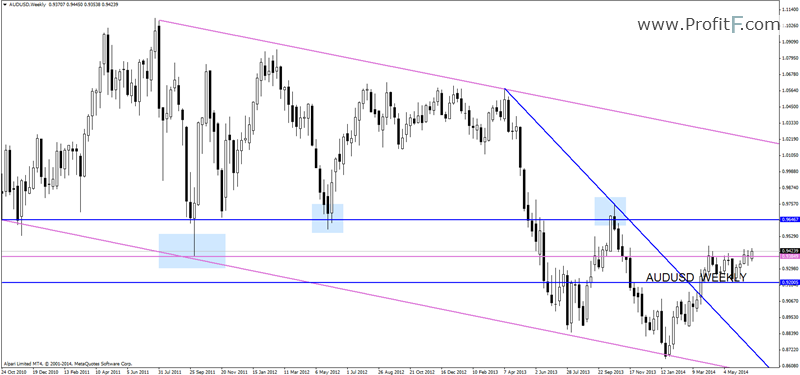
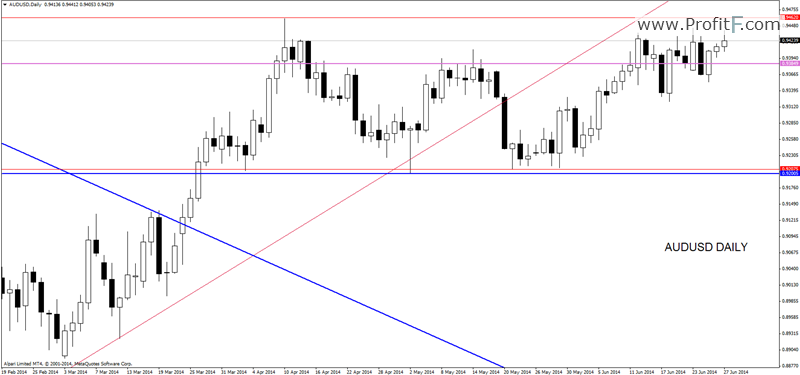
Commentary: Price is still inside the white pinbar on Monthly chart. On weekly and daily AUDUSD is still around monthly pivot.
Key levels – 0.947.
Last 3 days price goes up, to Daily resistance ( Red line). 0.947 level – here will watch Price Action signals to open short trade.
————————————————
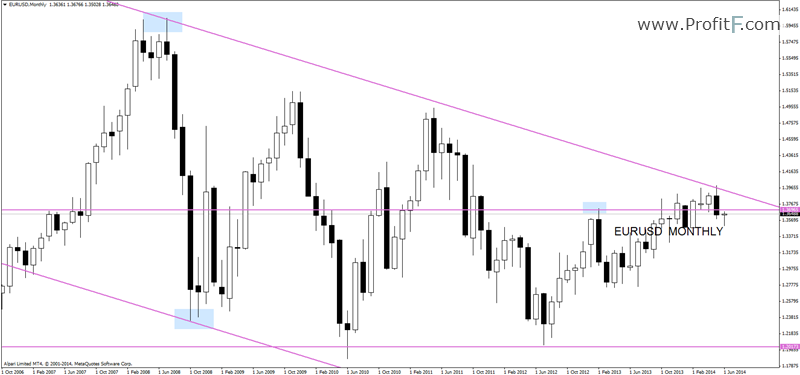
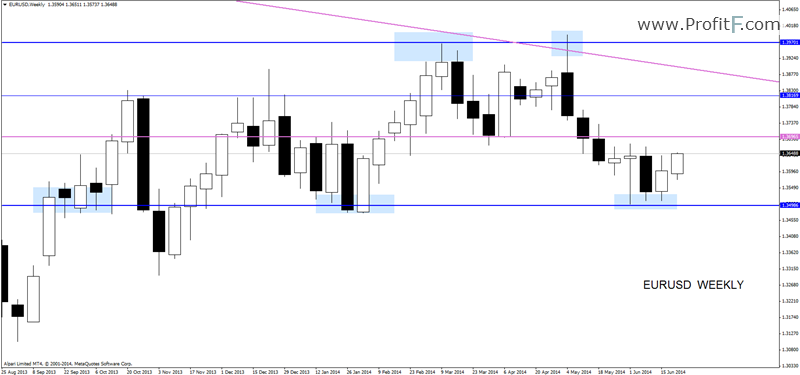
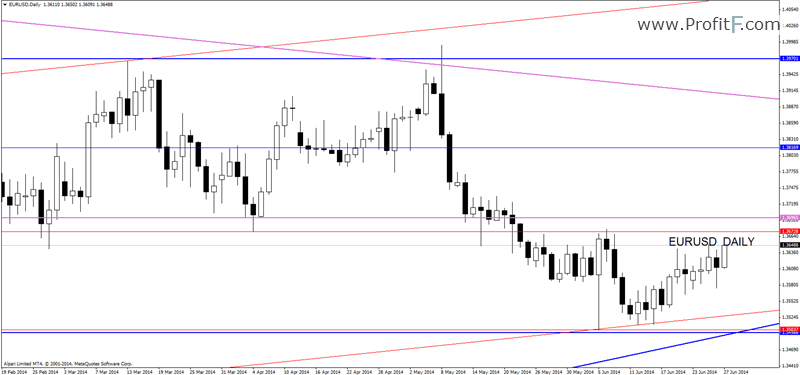
Commentary: On Monthly chart (TimeFrame-MN) price is inside the channel. Looks like this month will closing below Monthly resistance. And it will Pinbar candlestick. On Weekly chart (TimeFrame-W1) EURUSD is in inside the pinbar.
Key levels to watch are 1.367
1.367 – levels where we’re looking PA signals. We will search for sell opportunities.
————————————————
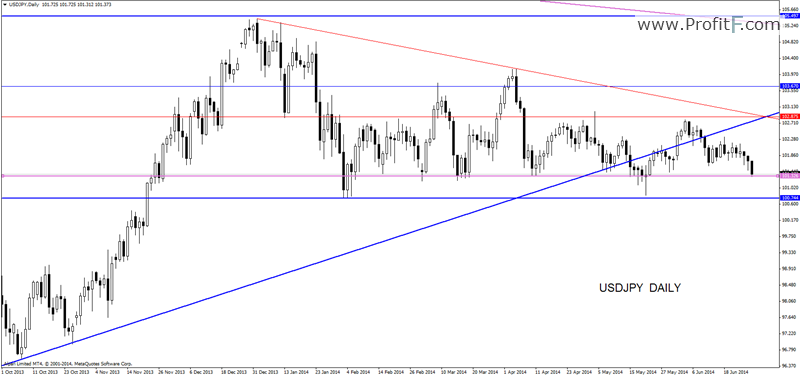
Commentary:
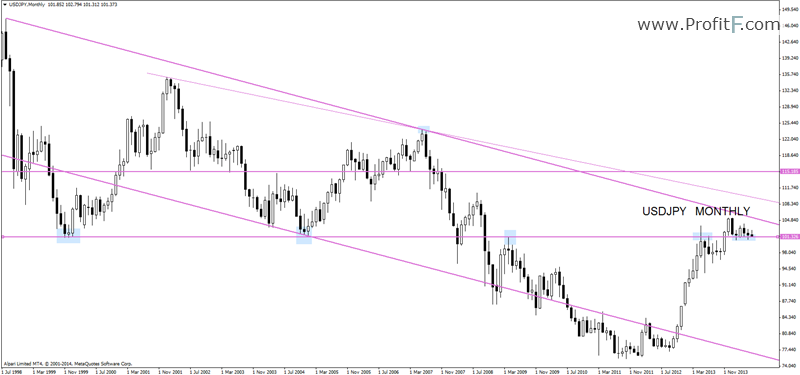
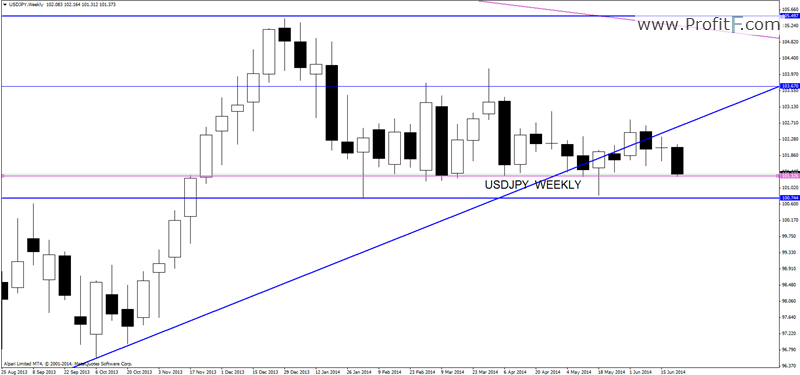
On Monthly chart (TimeFrame-MN) price is inside the channel. Weekly candlestick closed on monthly support line. Interesting note: ProfitF traders, look at W timeframe. Pink line at 101.3 level. In 2014 year price often tested this line but Weekly candlestick never closes below this line. 101.3 – strong support we think…Daily chart offers several areas of resistance. We see price under weekly trend line (blue line), daily trend line, daily resistance level.
Key level to watch – 100.8
Breakout support levels at 101.3 and 100.8 mean good opportunity to follow the down trend.
————————————————
————————————————
Add your review