TABLE OF CONTENTS:
Colors for Support, Resistance, Trend Lines: Monthly, Weekly, Daily
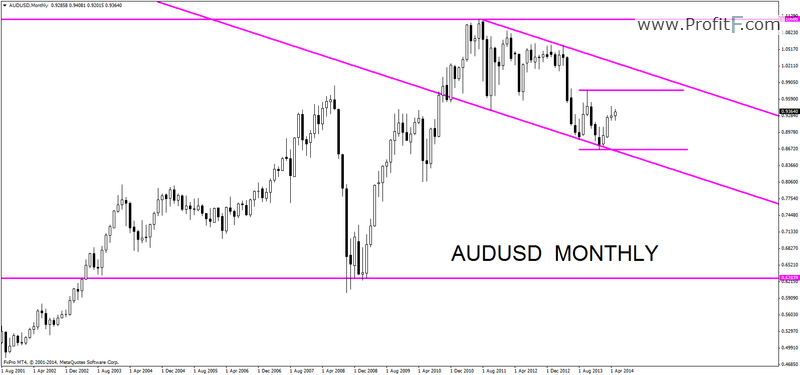
Monthly Commentary: Price is inside the channel, borders are respected.
——————————————
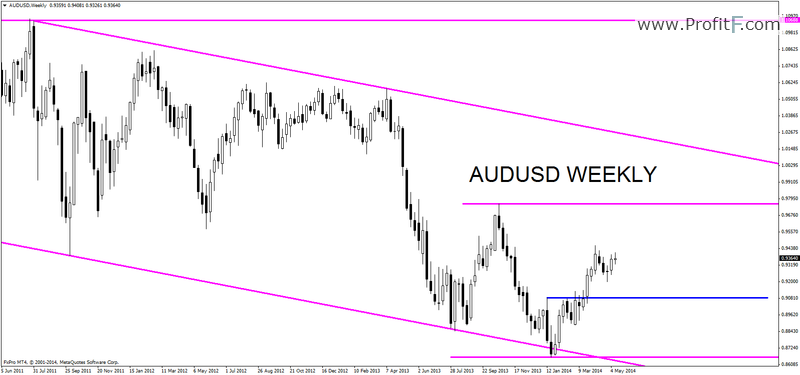
Weekly Commentary: Blue weekly resistance was broken and now it is support, we need to see lower time frame for entry.
——————————————-
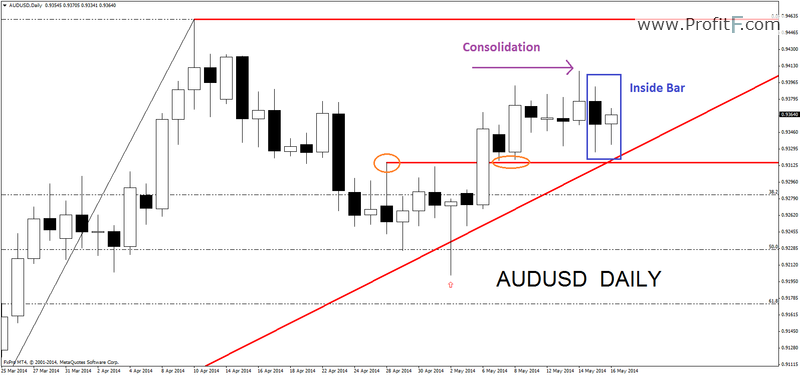
Daily Commentary: The trend is bullish, red daily trend line is respected. White pinbar shows rejection of daily trend line. It was ideal place for entry (red arrow), also 50% of Fibonacci`s level hold price above. Everybody who is in trade has profit. In this moment we have daily inside bar, possible new entry is above the mother bar. This is not ideal Risk Reward Ratio, because red resistance is above and according your stop loss position. Ideal entry will be if price retrace back to support and create again pinbar. We need to see what will happen.
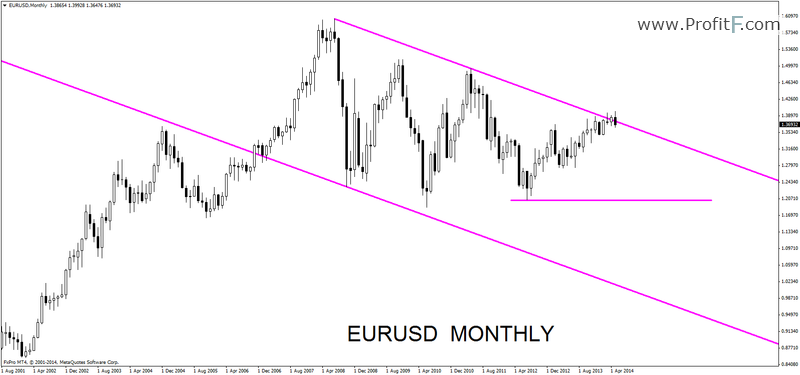
Monthly Commentary: Price is inside the channel, borders are respected.
——————————————–
Weekly Commentary: Price is in area where monthly channel and weekly resistance is.
———————————–
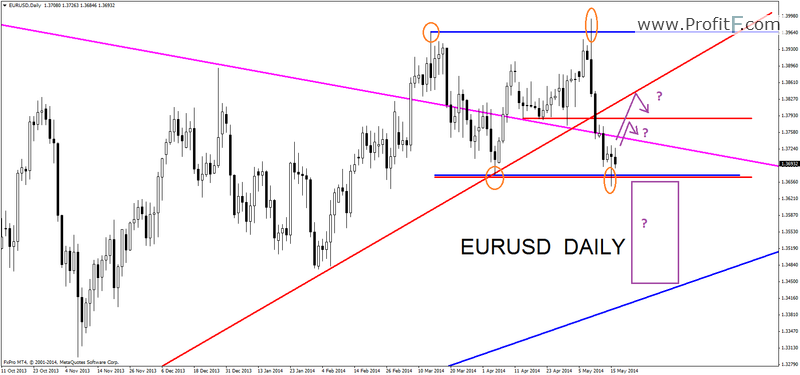
Daily Commentary: Last week red daily trend line was broken. Price is on daily and weekly support. Some traders can buy from support. If we will look together on each time frame, daily candles respects pink monthly channel. Next week will show how far price can go from support.

Monthly Commentary: Price is between monthly support and resistance.
—————————————————
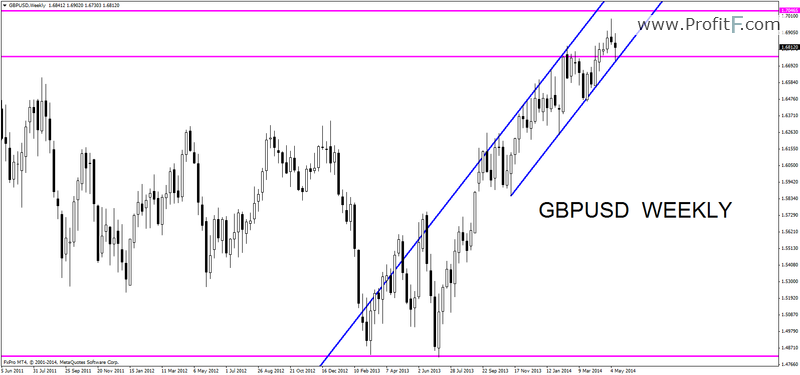
Weekly Commentary: Price is in weekly channel and above monthly support.
———————————————-
Daily Commentary: Price is in weekly channel and above monthly support. Trading plan: Fibonacci 50% rejection, monthly support, daily pinbar (red arrow), blue trend line. Ideal place for buy opportunity, each trader who opened above pinbar is in small profit now. Take profit is daily resistance. You can save your profits with partial closes.
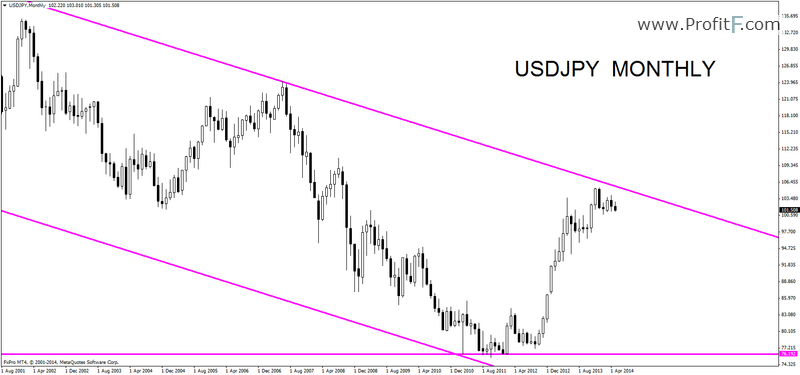
Monthly Commentary: Price is inside the channel, borders are respected.
————————————
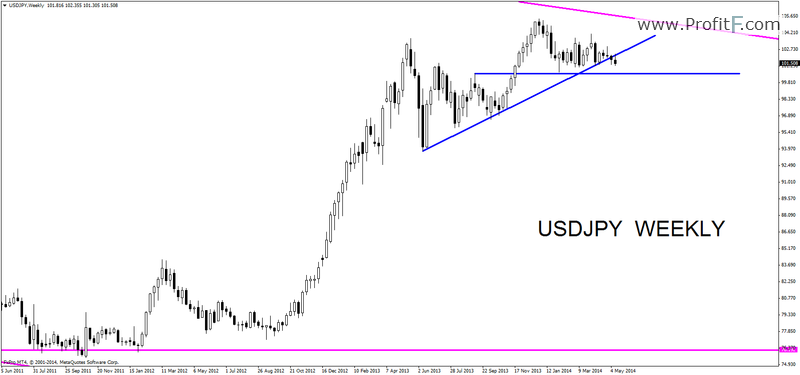
Weekly Commentary: Not clear, price is in area where weekly trend line is. We need to see lower time frame.
———————————–
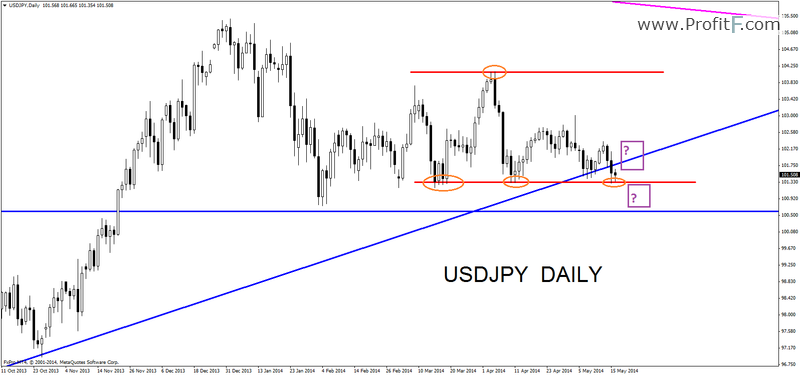
Daily Commentary: On daily chart is inside bar on support, possible entry is above the mother bar, it will be above weekly trend line too. But price failed few times and we can see lower highs and lower lows. Next week will show how far price can go from daily support.
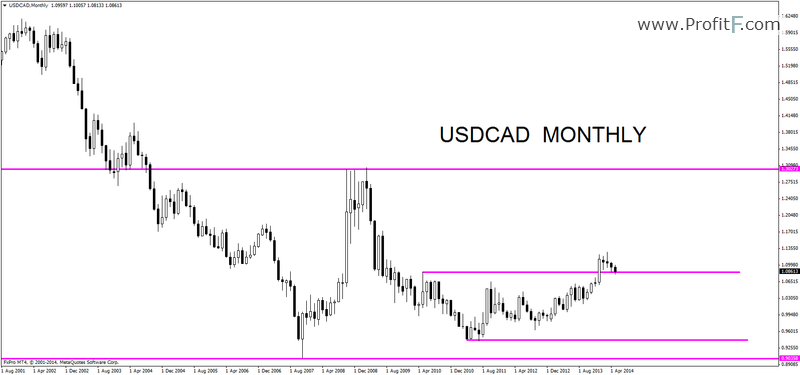
Monthly Commentary: After breakout price is back on support.
————————————
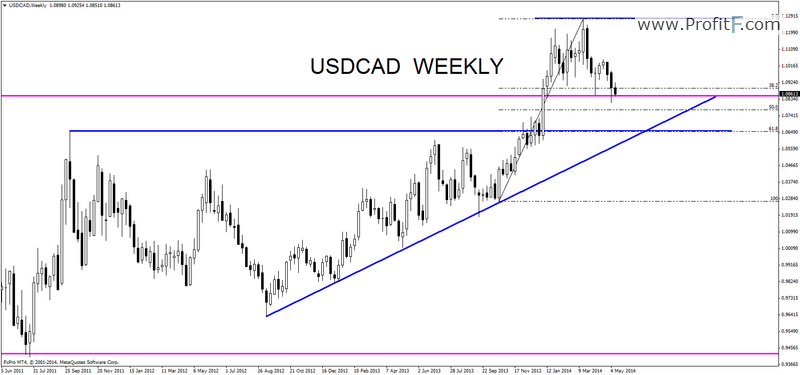
Weekly Commentary: There are clear weekly levels for support and trend line. We are testing monthly support too.
—————————————
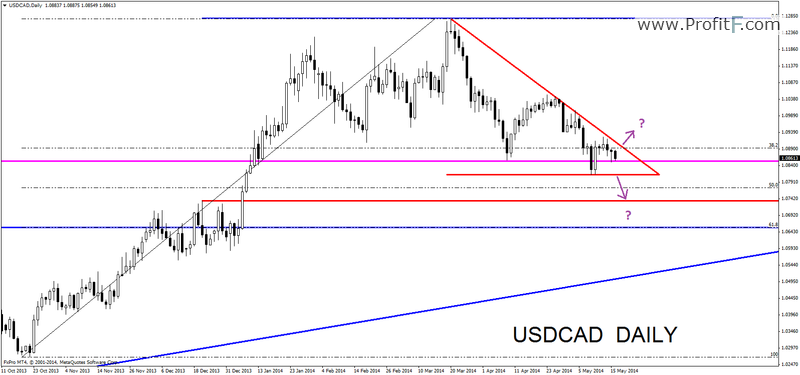
Daily Commentary: Price is in daily triangle. We need to wait for price reaction inside this area for clear direction.
Add your review