TABLE OF CONTENTS:
Colors for Support, Resistance, Trend Lines: Monthly, Weekly, Daily
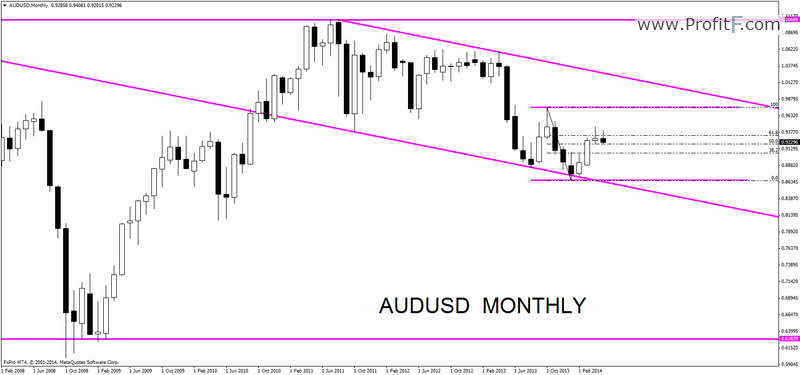
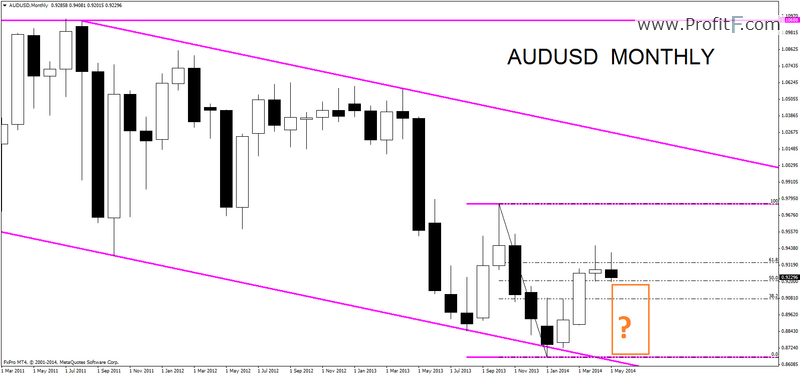
Monthly Commentary: Before the end of the month it looks like second monthly pinbar. ( ? What is Pin Bar? ) We are near 50% of Fibonacci retracement.
——————————————
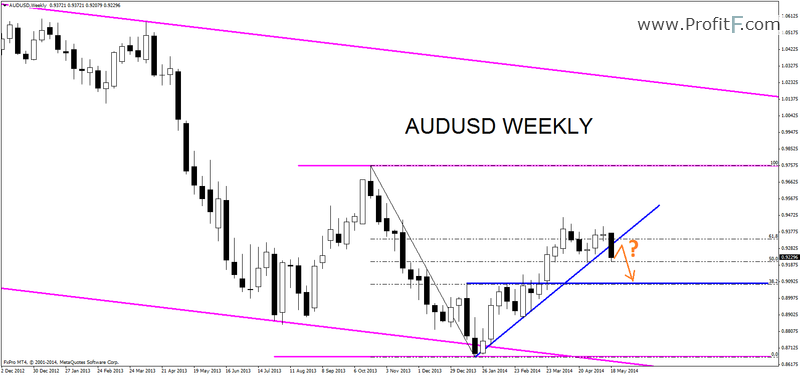
Weekly Commentary: Blue weekly trend line was broken and price closed as breakout. Main question could be are we going to retest blue support? Lower time frame can answer it.
——————————————-
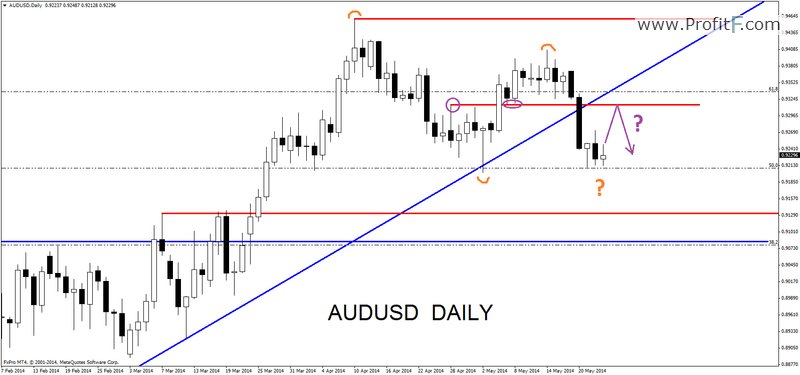
Daily Commentary: Price did nice breakout and weekly blue trend line was broken. Red daily resistance is valid; this is ideal area for new sell entry. But for down trend should be lower highs and lower lows, in this time there is not lower low yet. We need to see what will happen.
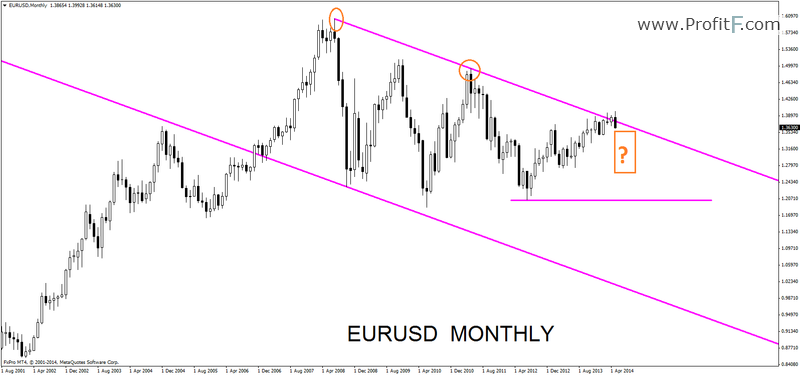
Monthly Commentary: Price is inside the channel, borders are respected. It looks that price can go down from monthly channel.
——————————————–
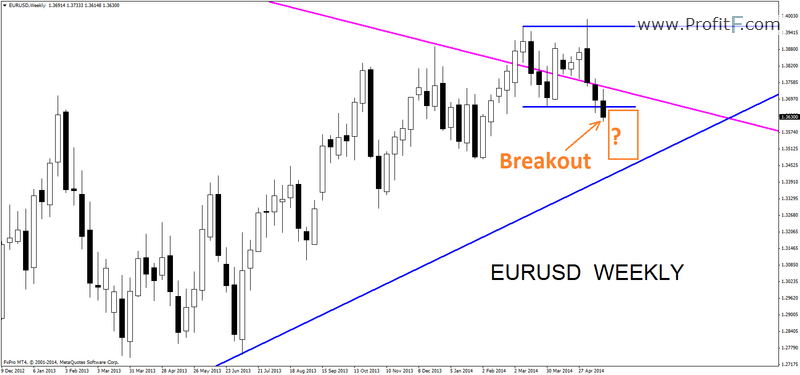
Weekly Commentary: Price closed below blue weekly support. It is good signal for searching to sell on lower timeframe.
———————————–
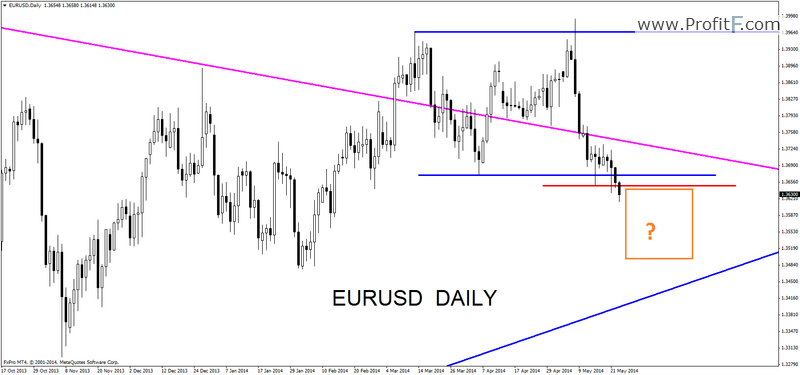
Daily Commentary: Price closed below weekly and daily support. Next week we can search for sell opportunities.

Monthly Commentary: Price is between monthly support and resistance.
—————————————————
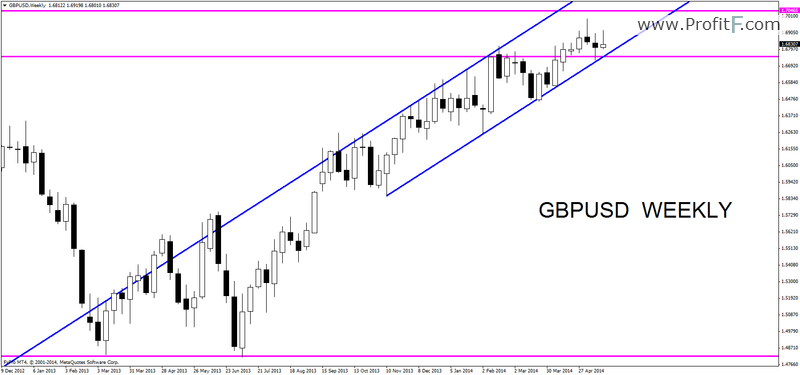
Weekly Commentary: Price is in weekly channel and above monthly support.
———————————————-
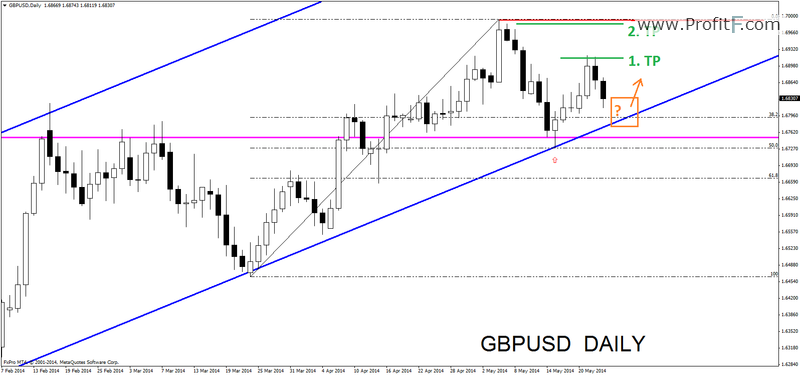
Daily Commentary: Red arrow was clear signal for buy. Do you see small distance between 1.TP (take profit) and 2. TP? If you closed 80% of your position you are in profit and 20% is in market, it doesn’t need to move stop loss. You can save your profits with partial closes. Now with 20% in market we can search for new entry for buy.
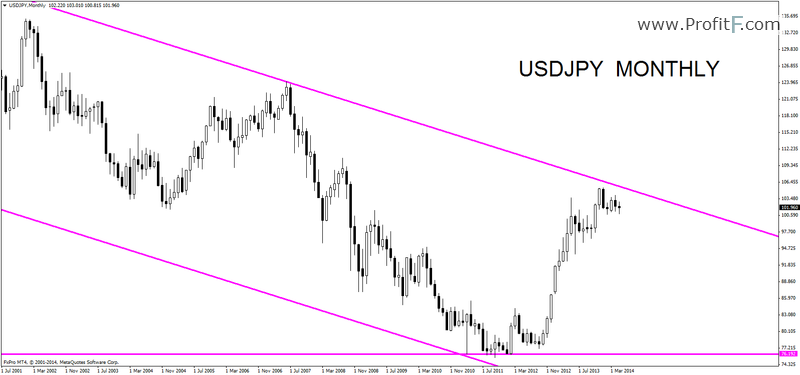
Monthly Commentary: Price is inside the channel, borders are respected.
————————————
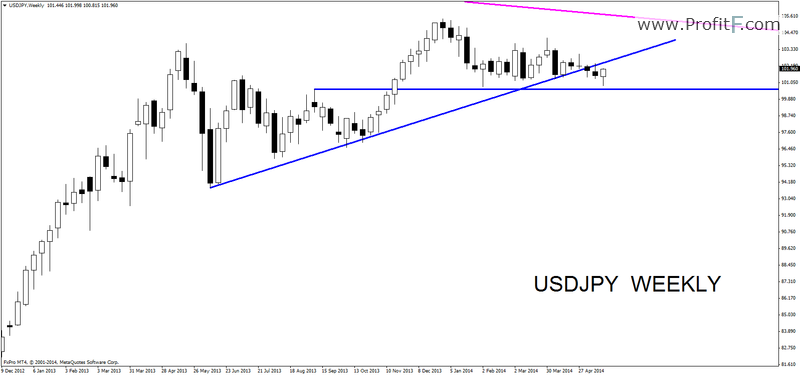
Weekly Commentary: Not clear, price is in area where weekly trend line is. We need to see lower time frame.
———————————–
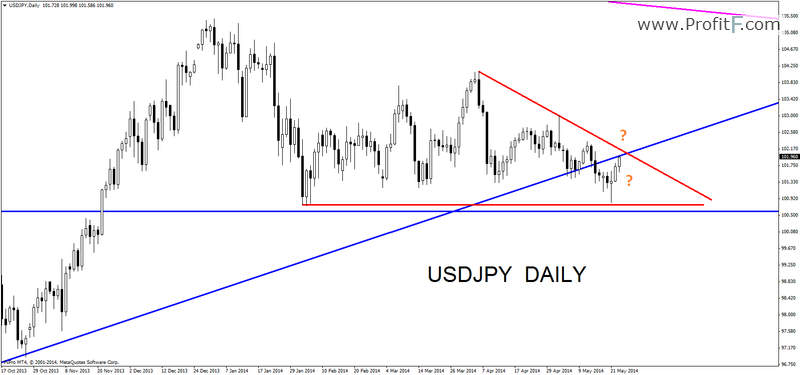
Daily Commentary: Price is inside the triangle. Some traders could search for sell opportunities because it looks like “small” down trend. Some traders are not trading inside the triangle.
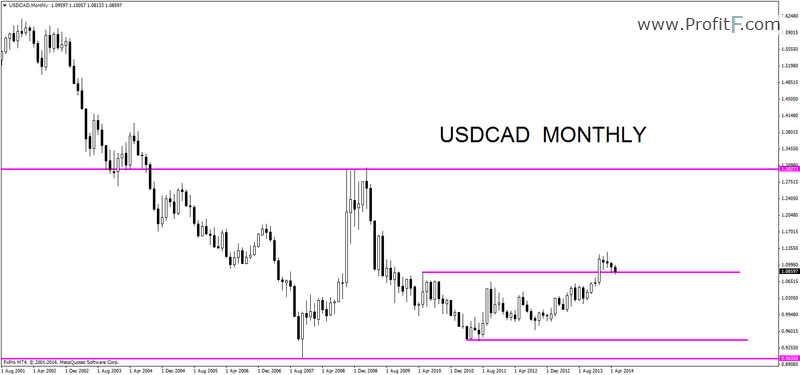
Monthly Commentary: After breakout price is back on support.
————————————
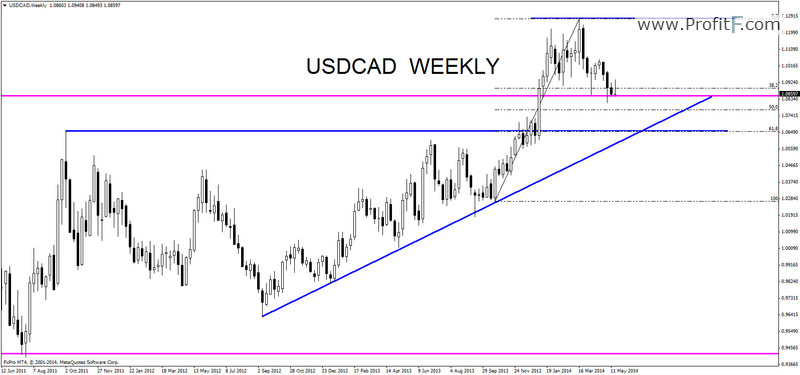
Weekly Commentary: There are clear weekly levels for support and trend line. We are testing monthly support too.
—————————————
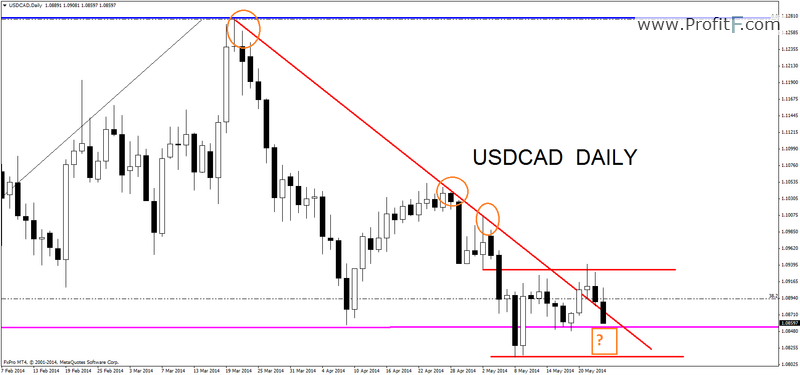
Daily Commentary: Price went out behind red daily trend line, but now is back. Some traders could sell on false daily breakout with sell stop order below white pinbar. Now they are in profit.
Add your review