GBPUSD trading plan.
Watch price action around 1,35 and 1,3115 and look for signals there. The pair is consolidating up after the post Brexit drop. Above 1,35, buy towards 1,385 and eventually above. Under 1,3115, sell towards 1,30, 1,28 and eventually lower.
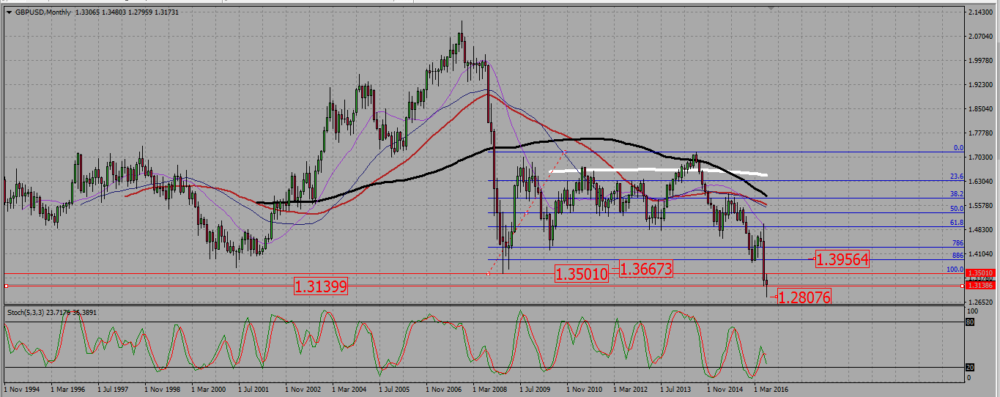
After falling to a low under 1,30 in the first half of July, the pair is now consolidating up, and it already took back last month low around 1,313. If anything, and although we are only at the middle of the month, July candle is looking more and more like a hammer. I am eventually expecting the cable to retest the low of the 2008 crisis near 1,35, and therefore I prefer not to enter a trade as long as the cable stays between those two values -1,313 -1,35-. but I will watch closely monitor price action there.
GBPUSD MONTHLY CHART.

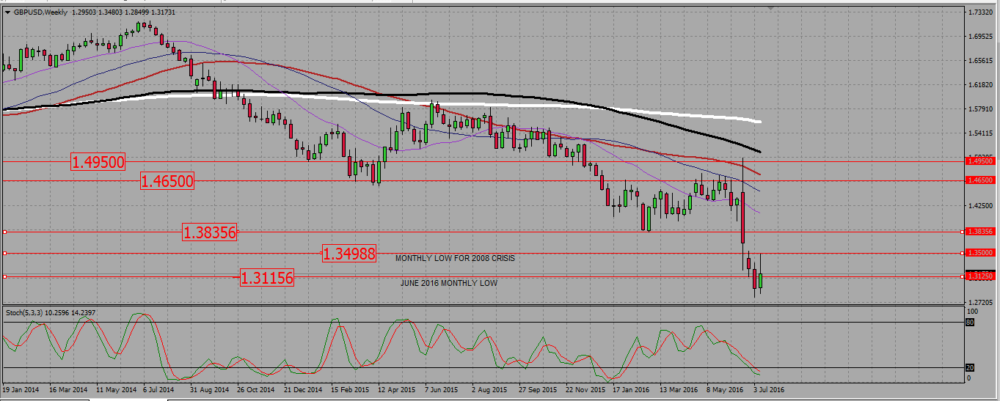
The weekly chart is clearly a bearish situation. Last candle, however, israther a strong bullish one, that actually retested the low of 2008. It then rejected it , and we see a long up wick on that candle. We need to check on the daily chart to see more clearly what happened after that 2008 low was retested.
GBPUSD WEEKLY CHART.

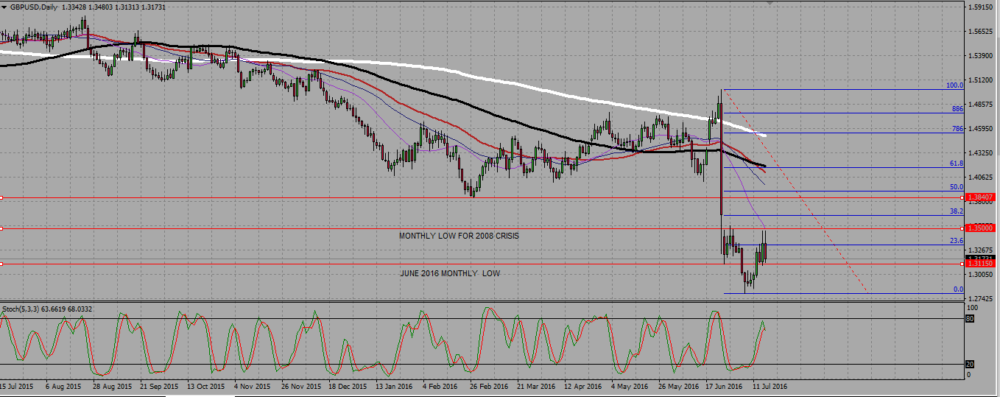
On the daily Forex chart we see the rejection of the 1,35 resistance being quite strong, with a dark cloud cover pattern. Such a pattern however does not constitute a selling signal, it just an indication to traders to close any long that they still have, and here we see all the candle closed right above last month low at 1,3115. I will closely monitor price action there.
GBPUSD DAILY CHART.

Add your review