1-USDCAD trading plan.
I am still bullish, but we are trading right under a monthly resistance. Make sure it is cleared before buying signals. Above 1,40, buy towards 1,45 and then 1,525. That pair is still run by fundamentals, and it is sent higher and higher by falling oil prices.
On the monthly chart we are still in a powerful uptrend, but the pair ended the week just under a 0,786 Fibonacci resistance around 1,4555. I will wait for getting that resistance clearly broken, or for seeing a bearish consolidation before looking to buy the USDCAD. If that 1,455 level is broken, the next resistance is the 0,886 Fibonacci level around 1,525.
USDCAD MONTHLY CHART.

The weekly chart shows us a clean uptrend, with a potential support near 1,395.
USDCAD WEEKLY CHART.

The daily chart shows the strength of that uptrend, with a strongly bullish last candle. There is also a stochastic bearish divergence, but it may be discarded considering the strength of the trend.
USDCAD DAILY CHART.

Finally the H4 will help us to find places to enter long trades. I will buy pull back to supports, in this case 1,438, 1,43, and 1,418.
USDCAD H4 CHART.

2-USDJPY TRADING PLAN.
The Yen is under a strong bearish consolidation. Sell signals under 118,3, but mind the support around 116.
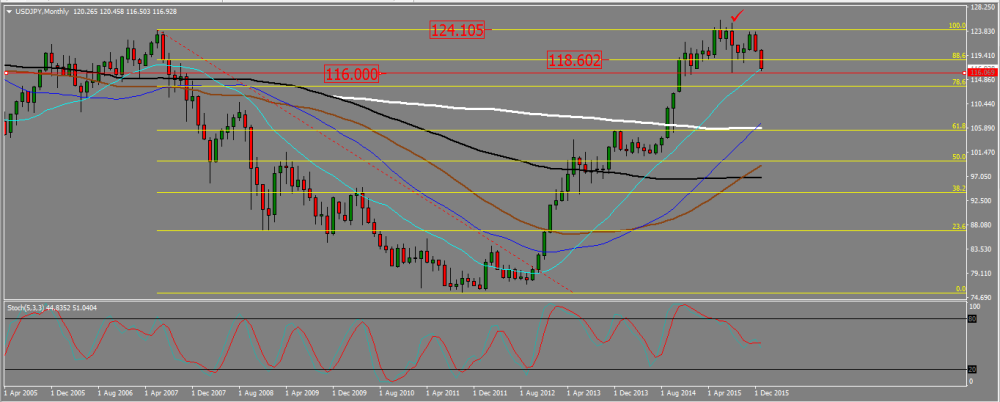
On the monthly chart, we see short term SMAs (20,40,55) pointing up and crossing the 100 SMA up. The 20 and 40 SMAs are also crossing the 200 SMA up. This suggest an uptrend taking place. However, July’s candle was a hanging man and made a high that has still not been broken. The two last candle show a strong bearish correction. We see a 0,886 Fibonacci resistance near 118,6, and there is a previous low, a support, around 1116.
USDJPY MONTHLY CHART.

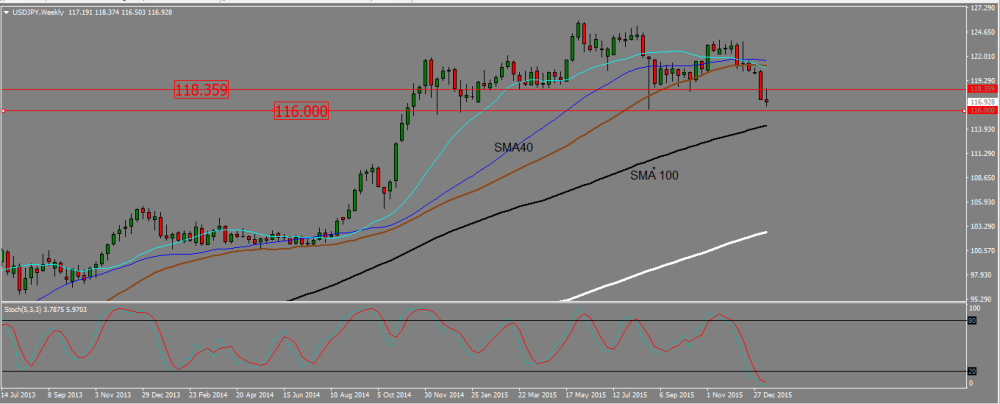
On the weekly chart, we see short terms SMA (20,40) starting to go down, but long term (100 and 200) are still firmly pointing up. I see it as indicating a bearish correction, but it is too early to say whether the trend is changing or not. Another thing is that the last candle is an indecision one, a bearish high wave candle. It may even be the start of a morning star.
We may also draw more precisely our 118,6 resistance. On that chart it rather looks like 118,3.
USDJPY WEEKLY CHART.

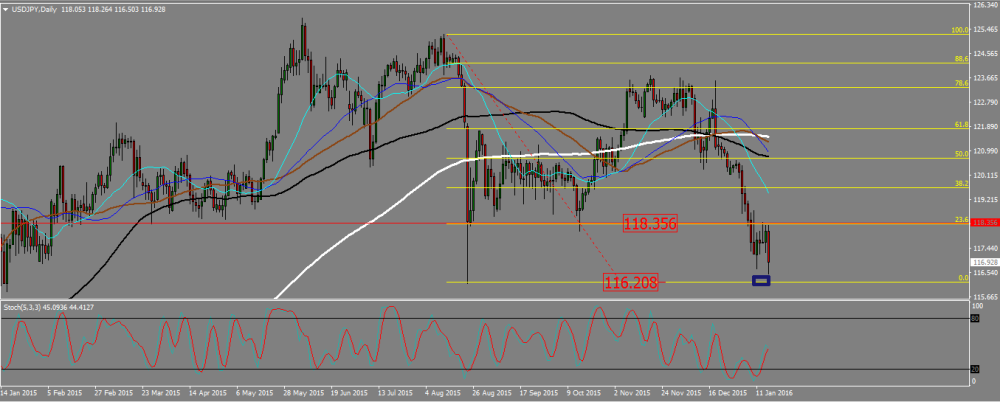
Finally, by taking a look at the daily, we first see the SMAs are in a mess, with no clear direction. This is a no-trend situation. Although there is a bearish move since the middle of December, bringing the pair from 123 to 117, we also see two strong down wicks on the candles from January 11st and January 15th. This indicates a support lying under, and it would not be wise to short a pair right above a support. I need a clean break down of the 116 level or a decent pull back and a new bearish signal before entering into a yen short trade. If the pair manages to go back to 118,5 and to break it up, I will consider the bearish correction is over and that we are back into the uptrend.
Please note the stochastic bullish divergence. In a no trend situation, this is something you want to consider, and it is another reason not to sell the yen without a pull back or a break out of 116 first.
USDJPY DAILY CHART.

Add your review