The USDJPY pair is falling brutally, but it is also getting close to a strong support near 105,5 that it rejected by the beginning of May. However, the bearish current move looks so powerful that the pair may just break down that support very soon. Sell confirmed break down of the support zone (105,75 105,25), towards the next strong support zone (102,5 – 101, on the weekly chart). I will not buy a rejection of the 105,5 support zone for this bearish move looks too strong for that.
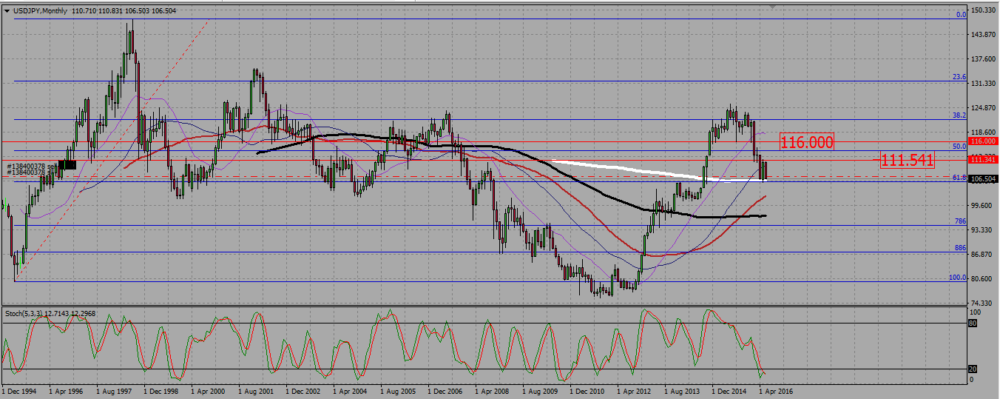
On the monthly chart, and after rejecting the 105,5 support in May, the pair could not pass the resistance at 111,5, and then brutally crushed down: this month candle, after only four days of trading, entirely reversed the whole candle for May. This is a very powerful move.
USDJPY MONTHLY CHART.

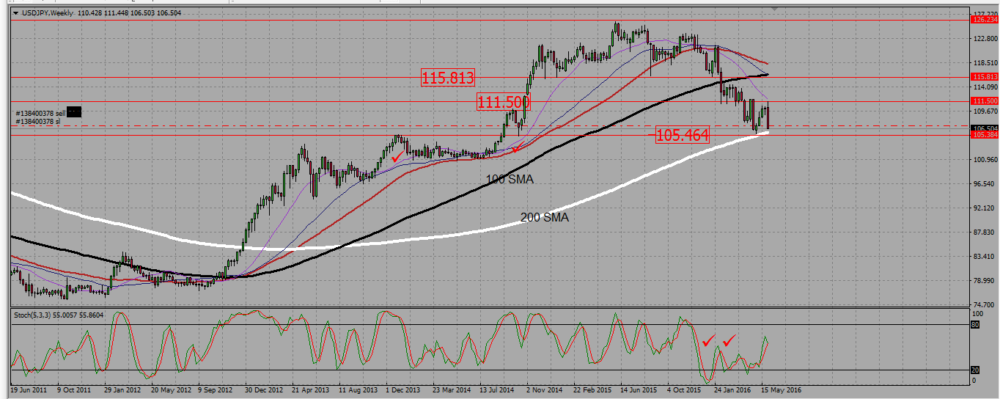
The weekly chart show a bearish consolidation of a bullish trend. However, the pair is starting to make new lows, and above all, rejected the resistance at 111,5 with a very strong bearish candle, and this week candle is also a powerful bearish one. We are indeed getting close to a strong support, but is is clear the bears have control of that market for the moment. Do they have enough strength to pus the pair below 105? I am not sure, but they are strong enough to make me unwilling to buy that pair for the moment.
The next support level on that chart is a zone between 102,5 and 101.
USDJPY WEEKLY CHART.

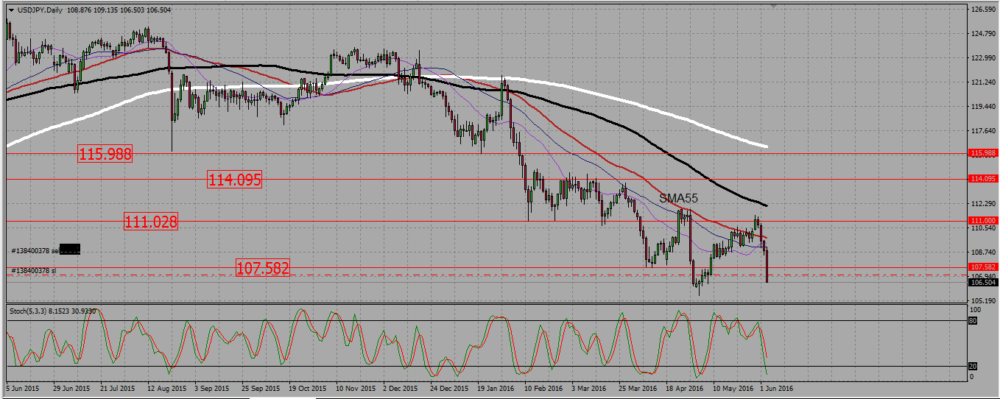
On the daily chart, there is a down trend. Friday candle is very strong, reflecting the moves post NFP, but is it worth noticing that USDJPY has been falling since Tuesday: that bearish thrust has deeper roots than just the NFP. This is why I prefer to look for selling signals between the resistance at 111 111,5 and the support zone at 102,5 101.
USDJPY DAILY CHART.
